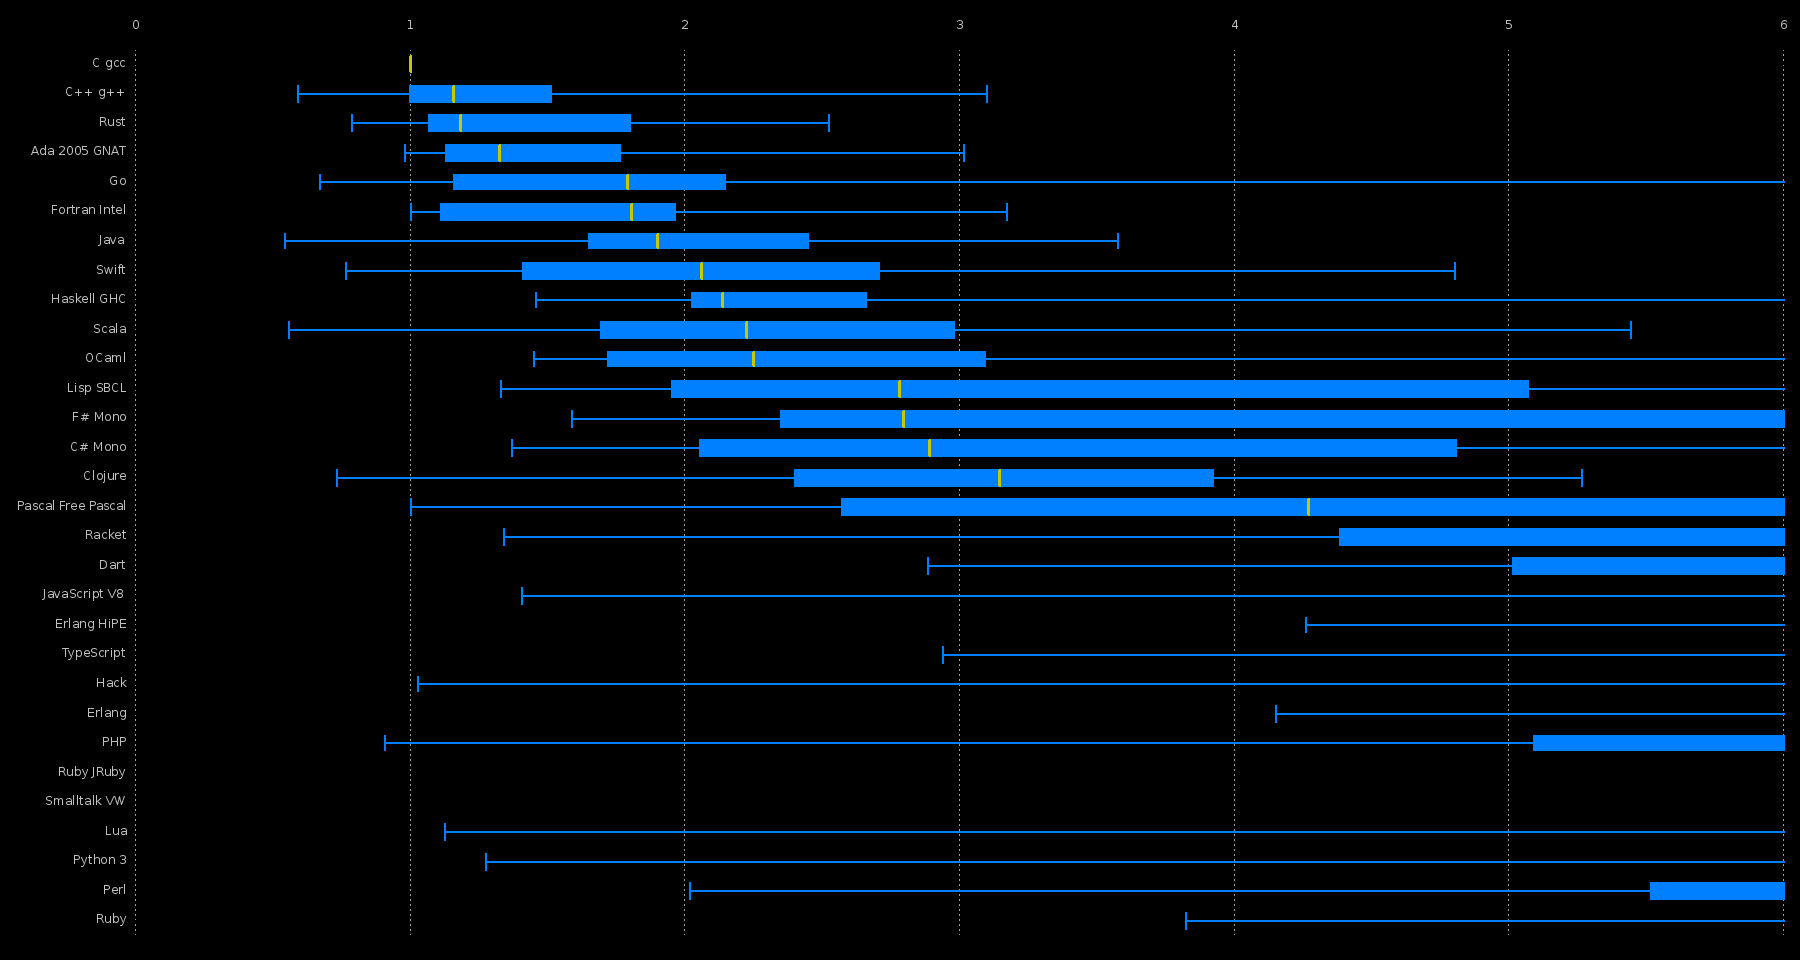
Programming Language Benchmark Game Visualisation
 BIG
BIG  BIG
BIG
All hard work was done by http://benchmarksgame.alioth.debian.org/ . I only wanted to see these graphs, maybe you too.
It shows the 64-bit Ubuntu quad core setup running speed results. Using C gcc as reference, ordered by median.
If you are interested in different graphs, you can change the code, and generate your graph. You will need ruby, gnuplot, and imagemagick.
On debian based systems:
$ sudo apt-get install imagemagick ruby gnuplot $ sudo gem install gnuplot Some paths and executrables are burned in, so you will have to change them.
Game
Do not forget that this is a game, my favourite language came last. Although it was fast enough to generate this graph.
Links
- http://benchmarksgame.alioth.debian.org/u64q/summarydata.php
- http://gnuplot.sourceforge.net/demo_4.3/candlesticks.html
- http://gnuplot-tricks.blogspot.hu/2009/10/turning-of-histogram.html
- https://gist.github.com/Antti/5773468


![[HBLOG]公众号](https://www.liuhaihua.cn/img/qrcode_gzh.jpg)

