在 Bluemix 上使用 Spark 在浏览器中分析天气数据
Apache® Spark™ 是用于内存中处理的一个开源集群计算框架。借助 Spark,分析应用程序的运行速度能够比目前市场上的同类可比技术快 100 倍。
“ 在本教程中,您将学习如何使用 iPython notebook 创建一个 Spark 实例,并使用 Spark API 在 Bluemix 上分析天气数据。 ”
在 2015 年 6 月,IBM 宣布了为开源 Apache Spark 项目提供支持,这使得 Spark 可充当 IBM Bluemix 云平台上的一项云服务。IBM 还根据 Spark 社区的一个机器学习许可发布了它的SystemML 软件。与此同时,IBM 还在旧金山开放了一个 Spark 技术中心,计划向一百多万名数据科学家和数据工程师传授 Spark 知识,帮助 3500 多名研发人员完成涉及 Spark 的项目工作。
在本教程中,您将学习如何使用 iPython notebook 创建一个 Spark 实例,并使用 Spark API 在 Bluemix 上分析天气数据。
这个分步示例将展示如何只通过用 Python 编写的几行代码轻松地在 IBM Bluemix 上分析数据。
学习本教程需要做的准备工作
- 一个Bluemix 帐户
- 基本了解 Apache Spark(有帮助但不是必需的)
- 熟悉 Python(有帮助但不是必需的)
第 1 步. 在您的 Bluemix Dashboard 上创建一个 Spark 实例
- 登录 到您的 Bluemix 帐户(或者注册 获得一个免费试用版)。
- 打开 Bluemix CATALOG 。
- 在 Data and Analytics 部分,选择 Apache Spark 。
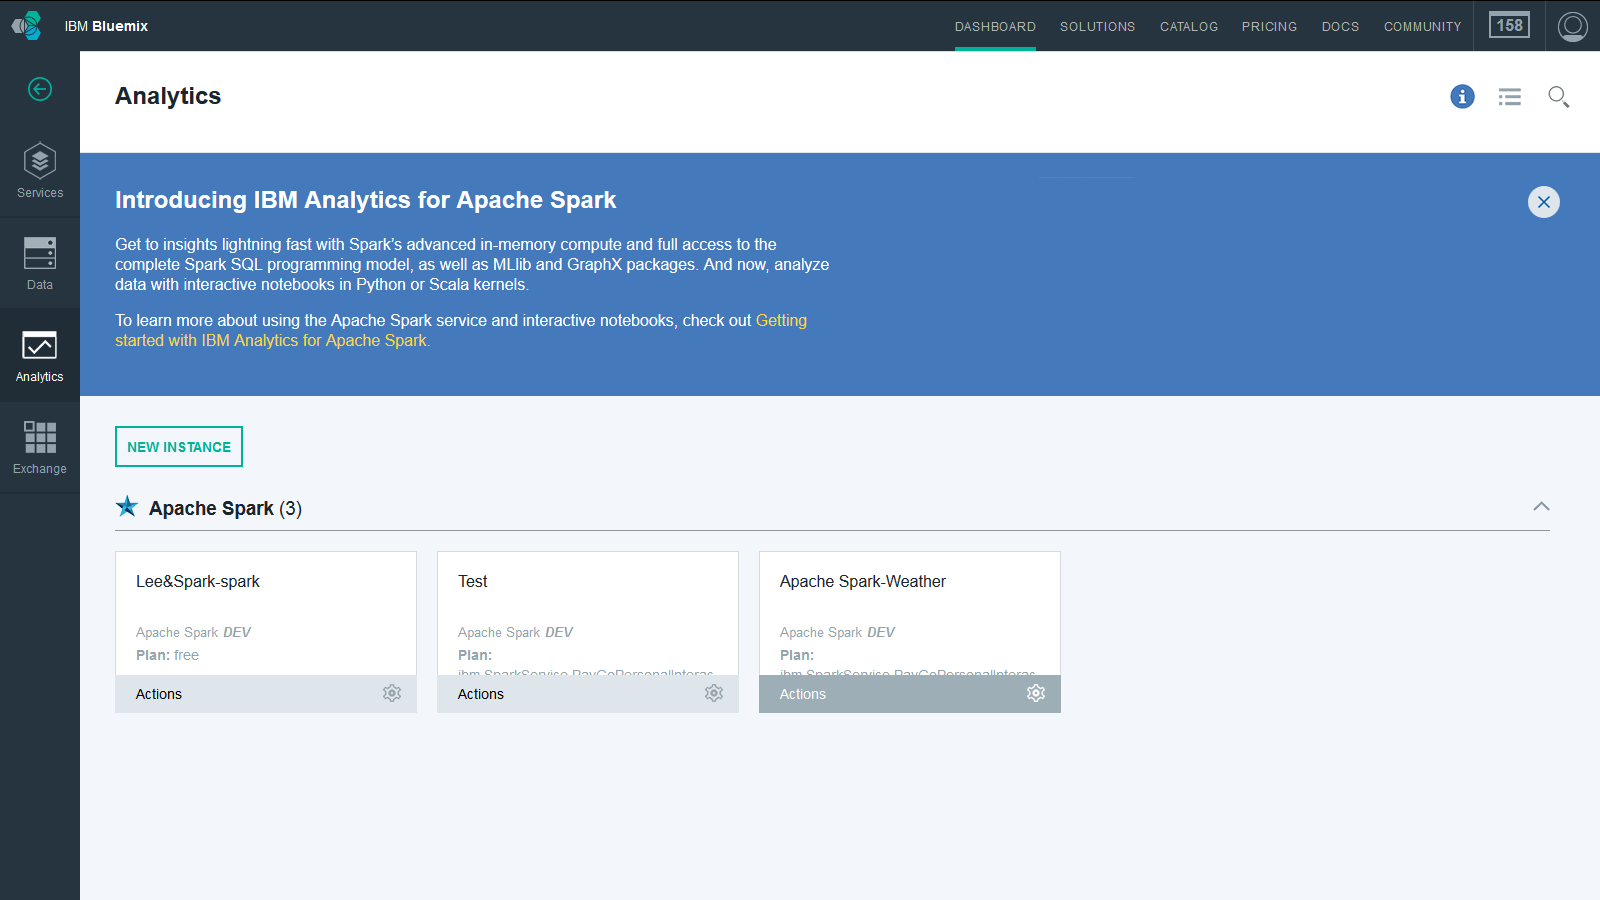
- 在 Service name 字段中,指定您的服务名称,例如 Apache Spark-Weather ,并保留其他字段的默认值。不需要将该服务绑定到应用程序。
- 单击 CREATE ,然后等待将要配置的服务。
- 单击右上角的 OPEN 。


- 这会将您带到 Spark Instances 的控制台。单击您新建的服务。

第 2 步. 在您的 Spark 实例上创建一个 iPython
您可以创建一个 iPython notebook、上传一个现有的 notebook 或者使用一个 Bluemix 示例。要创建一个新的 notebook:
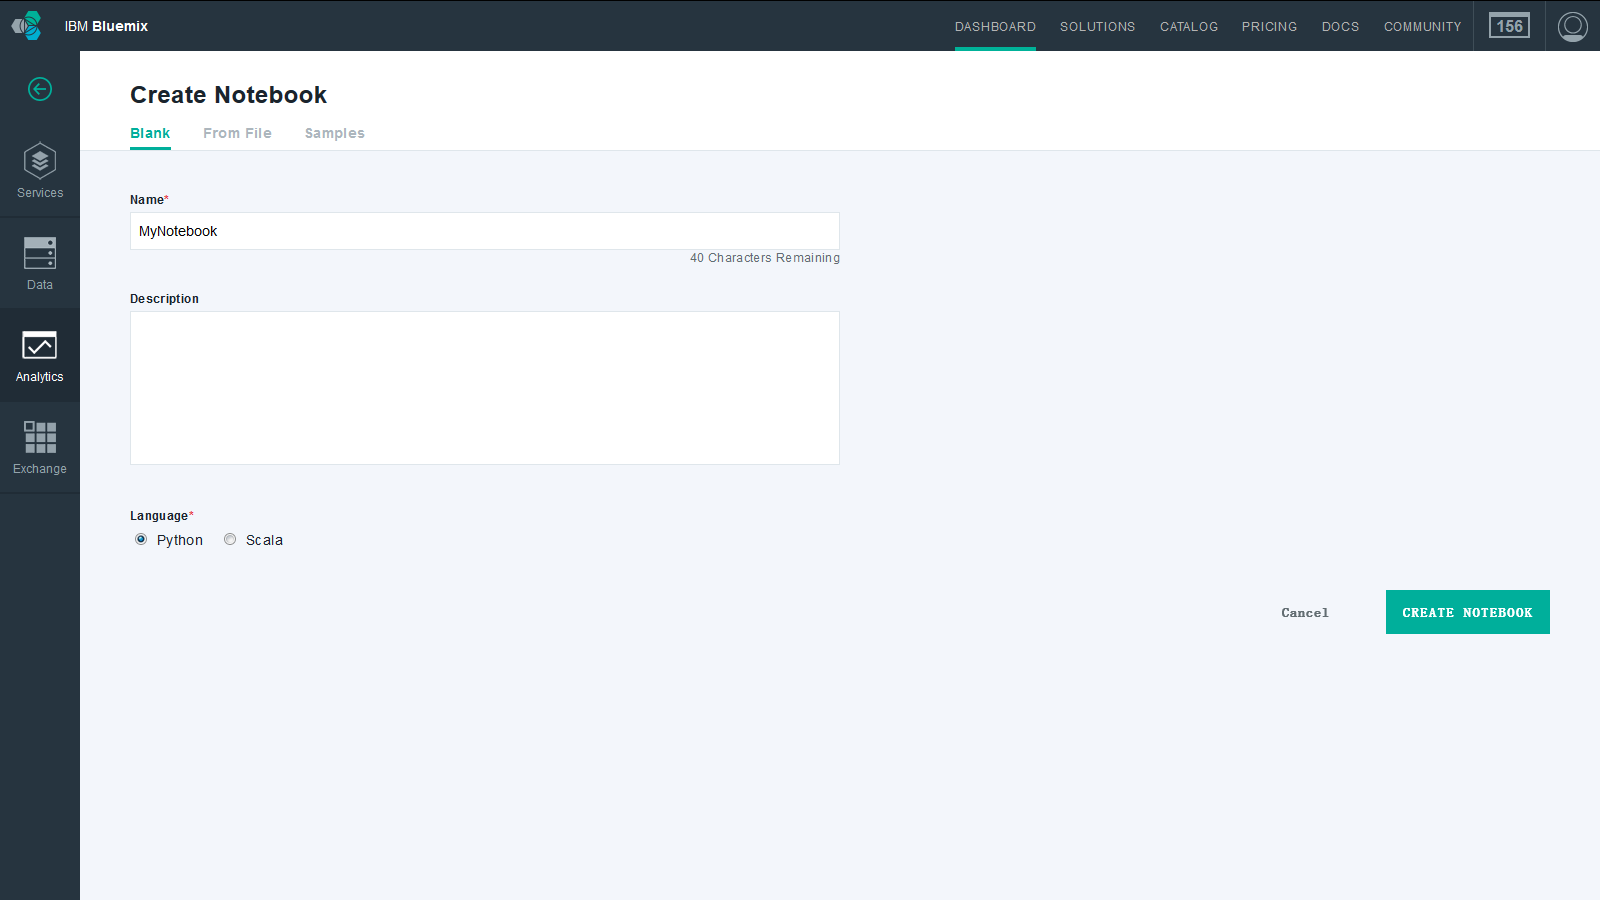
- 单击页面左下方的 NEW NOTEBOOK 。
- 在 Blank 选项卡中,输入您的 notebook 的 Name ,然后选择 Python 作为 Language 并单击 CREATE NOTEBOOK 。

第 3 步. 将数据更新到您的 notebook
- 访问 National Centers for Environmental Information (NCEI) 站点: http://www.ncdc.noaa.gov/data-access/quick-links 。
- 单击第二个链接 Global Historical Climatology Network-Daily (GHCN-D) 。
- 单击 GHCN-Daily FTP Access 链接。
- 单击 by_year 文件夹链接。
- 滚动到底部并单击 2015.cs.gz 链接来下载它。
- 在您的本地平台上使用适当的工具解压
2015.cs.gz文件。在您喜爱的文本编辑器中打开得到的.csv文件,并将以下列标题作为首行添加到文件中:
STATION,DATE,METRIC,VALUE,C5,C6,C7,C8 -
2015.csv列包含一个天气站标识符、一个日期、一个将被收集的度量数据(降水量、每日最高温和最低温、观测时的温度、降雪、积雪深度,等等),列 C5 到 C8 包含其他一些信息。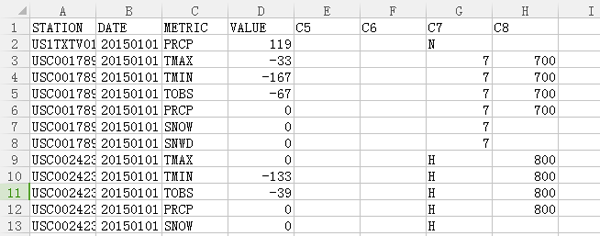
- 将
.csv文件上传到您的 notebook。将整个文件上传到 Object Storage 需要花费几分钟的时间。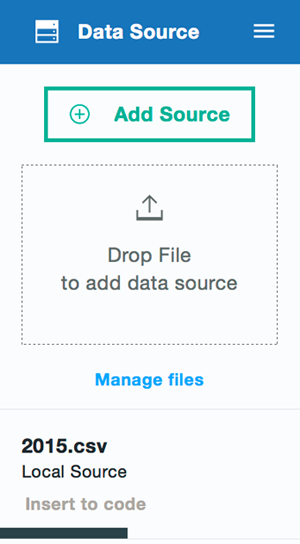
第 4 步. 创建一个 RDD
接下来,使用 SparkContext 根据 2015.csv 文件创建一个 RDD。
- 在使用 SparkContext 访问 Object Storage 中的存储文件之前,设置 Hadoop 配置。这可以使用以下函数完成:
def: set_hadoop_config(credentials prefix = "fs.swift.service." + credentials['name'] hconf = sc._jsc.hadoopConfiguration() hconf.set(prefix + ".auth.url", credentials['auth_url']+'/v2.0/tokens') hconf.set(prefix + ".auth.endpoint.prefix", "endpoints") hconf.set(prefix + ".tenant", credentials['project_id']) hconf.set(prefix + ".username", credentials['user_id']) hconf.set(prefix + ".password", credentials['password']) hconf.setInt(prefix + ".http.port", 8080) hconf.set(prefix + ".region", credentials['region']
- 单击工具栏中的 Insert 按钮来插入一个单元格,并将代码粘贴到该单元格中。然后单击 Run 按钮来执行该代码。

- 在执行该代码后,一个用括号括起来的数字会出现在
In的旁边。该数字表明了整个 notebook 中的代码单元格的执行顺序。在本例中,该数字是[1]。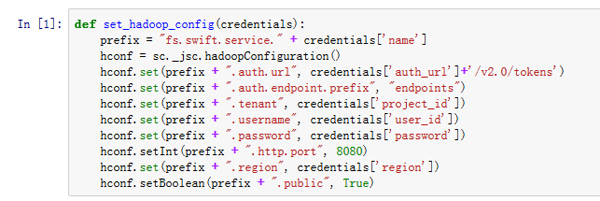
- 单击 Insert to code 创建一个新的代码单元格。
.csv文件的凭证会自动粘贴到其中。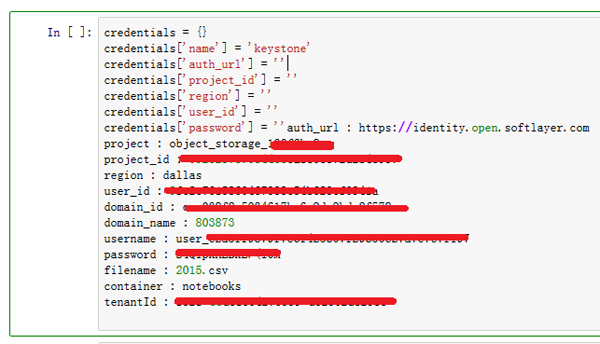
- 为了方便起见,我们将提供的凭证复制到某个文档中供进一步使用。我们已经使用访问 Object Storage 所需的条目完成该代码,所以您只需粘贴
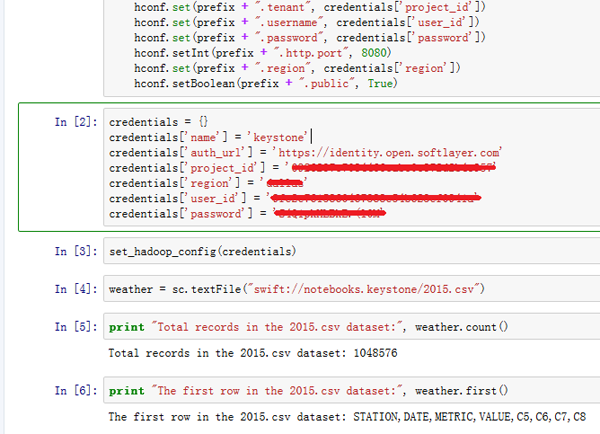
credentials行并运行该单元格。对于密钥的'name',可以输入任何字符串作为该值。在这个示例中,使用的是'keystone'。credentials = {} credentials['name'] = 'keystone' credentials['auth_url'] = 'https://xxxx.xxxxxxx.xxx' credentials['project_id'] = 'xxxxxxxxxxx' credentials['region'] = 'xxxxxxxxxxxx' credentials['user_id'] = 'xxxxxxxxxxxxxx' credentials['password'] = 'xxxxxxxxxxxx' - 现在,您可以通过运行以下代码来设置 Hadoop 配置:
set_hadoop_config(credentials)
- 使用存储在 Object Storage 中的原始数据文件,您现在可以通过运行下列代码,在您的 notebook 中使用已配置好的 SparkContext 访问它:
weather = sc.textFile("swift://notebooks.keystone/2015.csv") - 您创建的 RDD 是一个字符串集合,这些字符串对应于原始数据文件中的各行。重要的是要记住:RDD 虽然已经定义了,但尚未将它实例化。对 RDD 应用一个类似
count的操作,强制高效完成其实例化:print "Total records in the 2015.csv dataset:", weather.count()
-
您可以对相同的 RDD 应用其他操作,以查看第一行数据。
print "The first row in the 2015.csv dataset:", weather.first()
结果应该如下所示
第 5 步. 解析和分析数据
- 要真正开始处理数据,需要将它们解析成列。这是通过将 RDD 中的每一行映射到一个(用逗号划分行的)函数来完成的。
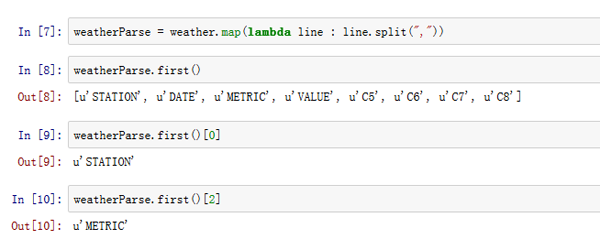
weatherParse = weather.map(lambda line : line.split(","))Python 中的
lambda符号用于创建未绑定到某个名称的匿名函数。此概念被用于上述代码中,以便将某个函数作为映射函数的参数进行传递。匿名函数接收来自 RDDweather的每一行,并用逗号分隔它们。因此,新的 RDD
weatherParse被定义为字符串列表的一个列表。并且每个列表中的字符串是该行的各个元素。 - 下面就让我们来看看第一个列表:
weatherParse.first()
- 现在,让我们来看看第一个列表的各个元素,该列表的第一项开始于偏移量零:
weatherParse.first()[0]
- 您还可以通过索引拉取其他元素。
weatherParse.first()[2]
- 现在,您可以通过只选择包含降水量数据值的行来减少数据集,在这些行中,
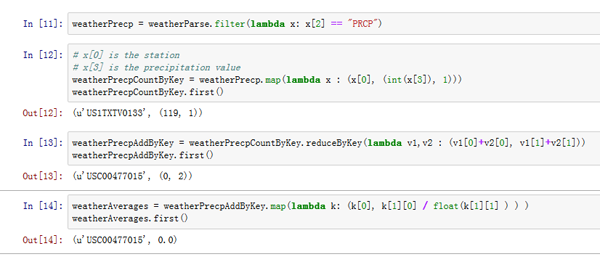
METRIC列等于PRCP。 - RDD
weatherPrecp包含一个队值 (v1, v2) 列表,其中 v1 是一个气象站标识符,v2 是该气象站的一次降水数据点(一天)。下面的表 1 展示了这种结构。表 1.
键 值 气象站 1 值 1 气象站 2 值 2 气象站 1 值 3 气象站 2 值 4 气象站 3 值 5 ... ... - 接着,将该数据集转换(映射)到一个新的数据集,其中每行(数据对)都增加 1。下面的表 2 展示了这种新的结构。
表 2.
键 值 气象站 1 (值 1,1) 气象站 2 (值 2,1) 气象站 1 (值 3,1) 气象站 2 (值 4,1) 气象站 3 (值 5,1) ... ... - 现在,通过运行下列代码创建
weatherPrecpCountByKey。
# x[0] is the station # x[3] is the precipitation value weatherPrecpCountByKey = weatherPrecp.map(lambda x : (x[0], (int(x[3]), 1))) weatherPrecpCountByKey.first()
表 2 只是一个过渡。因为随后能够将表 2 的映射精简成表 3 所表示的形式。
表 3.
键 值 气象站 1 (值 1 + 值 3,2) 气象站 2 (值 2 + 值 4,2) 气象站 3 (值 5,1) ... ... 在该表中,通过用相应的计数除以值的总和,可以计算出每个气象站的平均降水量。使用来自 Spark API 的
reduceByKey函数生成表 3。weatherPrecpAddByKey = weatherPrecpCountByKey.reduceByKey(lambda v1,v2 : (v1[0]+v2[0], v1[1]+v2[1])) weatherPrecpAddByKey.first()
- 现在,您可以最终计算每个气象站的平均值。通过用一个函数映射
weatherPrecpAddByKeyRDD 来创建weatherAveragesRDD,该函数将用总的读数除以总的降水量。weatherAverages = weatherPrecpAddByKey.map(lambda k: (k[0], k[1][0] / float(k[1][1] ) ) ) weatherAverages.first()
- 现在,您可以打印前十个气象站及其平均降水量。
for pair in weatherAverages.top(10): print "Station %s had average precipitations of %f" % (pair[0],pair[1])
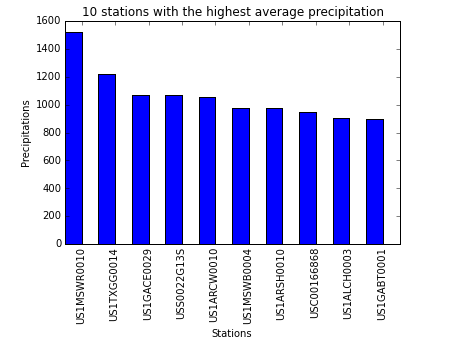
- 如果想要输出具有最高平均降水量的 10 个气象站,可反转成对出现的气象站 ID 和平均值的顺序。要实现此操作,只需使用一个交换对值顺序的函数。
precTop10=[] stationsTop10=[] for pair in weatherAverages.map(lambda (x,y) : (y,x)).top(10): precTop10.append(pair[0]) stationsTop10.append(pair[1]) print "Station %s had average precipitations of %f" % (pair[1],pair[0])
- 使用交互式 notebook,很容易创建这些结果的曲线图。
%matplotlib inline import numpy as np import matplotlib.pyplot as plt N = 10 index = np.arange(N) bar_width = 0.5 plt.bar(index, precTop10, bar_width, color='b') plt.xlabel('Stations') plt.ylabel('Precipitations') plt.title('10 stations with the highest average precipitation') plt.xticks(index + bar_width, stationsTop10, rotation=90) plt.show()
结束语
Apache Spark 是首次让全新功能完全可用于数据科学家、业务分析师和应用程序开发人员的下一代分布式数据处理引擎。Analytics for Apache Spark 通常与 IBM Bluemix 中的工具一起使用,让您可以快速启用 Apache Spark 的全部力量。本教程介绍了如何使用 iPython Notebook(它使用了 Spark API)分析来自真实世界的原始天气数据。您可以轻松地用这个示例作为 Bluemix 上的更多分析的基础。


![[HBLOG]公众号](https://www.liuhaihua.cn/img/qrcode_gzh.jpg)

