强推! angular 模块依赖分析 可视化哦
grunt-angular-architecture-graph 
Create graphs of your angular projects using angular-architecture-graph.
Getting Started
This plugin requires Grunt ~0.4.5
If you haven't used Grunt before, be sure to check out the Getting Started guide, as it explains how to create a Gruntfile as well as install and use Grunt plugins. Once you're familiar with that process, you may install this plugin with this command:
npm install grunt-angular-architecture-graph --save-dev
Once the plugin has been installed, it may be enabled inside your Gruntfile with this line of JavaScript:
grunt.loadNpmTasks('grunt-angular-architecture-graph');
The "angular_architecture_graph" task
OS X
Requirements
- graphviz
if running OS X and using homebrew, simply execute:
brew install graphviz Windows 7
Requirements
The windows installer of graphviz: graphviz-X.XX.msi , remember to set the Path and point it to your bin directory. e.g. C:/Program Files (x86)/GraphvizX.XX/bin .
Manjaro 0.8.11 (arch linux)
Requirements
Install via yaourt the graphviz package e.g.: yaourt graphviz .
General
Requirements
Make sure the following grunt packages are installed:
- grunt-graphviz
- grunt-angular-architecture-graph
You only need to load the grunt-angular-architecture-graph in your grunt file.
Gruntfile
In your project's Gruntfile, add a section named angular_architecture_graph to the data object passed into grunt.initConfig() .
angular_architecture_graph: { diagram: { files: { // "PATH/TO/OUTPUT/FILES": ["PATH/TO/YOUR/FILES/*.js"] "architecture": [ "<%= projectConfig.app %>/<%= projectConfig.project %>/**/*.js" ] } } }
execute the task and the diagrams will be in the output folder, in this example it is in the folder architecture .
Demos

-
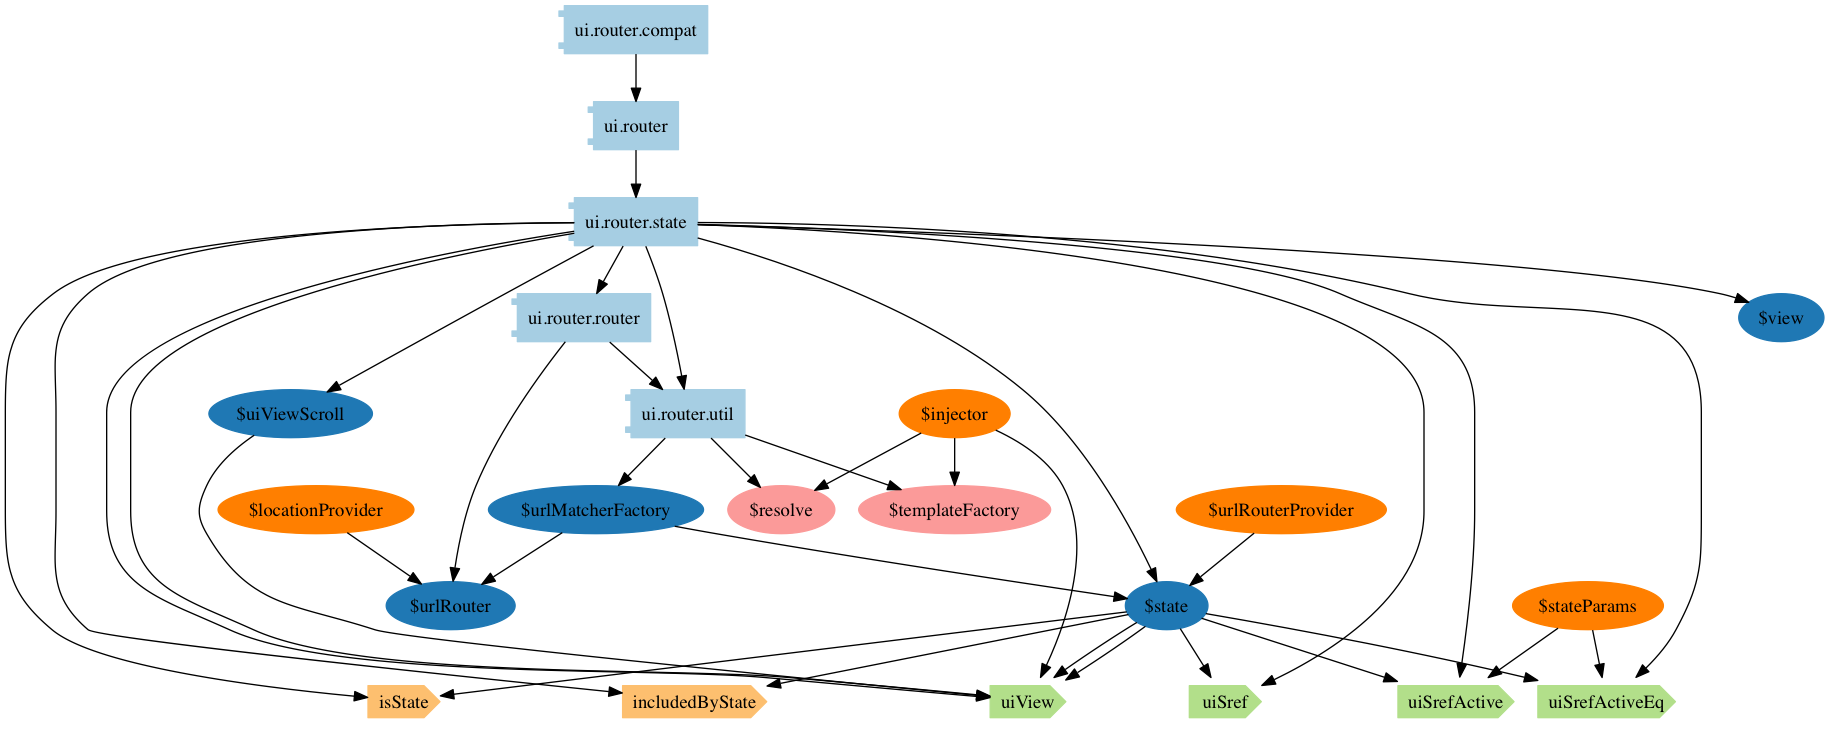
ui-router overview diagram

-
ui-router ui.router.state module

-
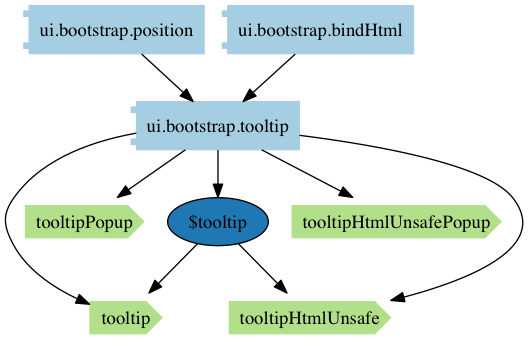
ui-bootstrap

-
ui-bootstrap ui.bootstrap.tooltip module

Options
options.hideAngularServices
Type: Boolean Default value: true
A boolean value that shows angular services (e.g. $http, $q) as dependencies when set to false.
hideAngularServices: false
options.shapeModules
Type: String Default value: component
A string value that allows you to change the default shape used for
- module
nodes.
shapeModules: 'triangle'
options.shapeFactories
Type: String Default value: ellipse
A string value that allows you to change the default shape used for
- Provider
- Controller
- Service
- Factory
- Injected Service
nodes.
shapeFactories: 'house'
options.shapeDirectives
Type: String Default value: cds
A string value that allows you to change the default shape used for
- Filter
- Directive
nodes.
shapeDirectives: 'trapezium'
Available graphviz shapes are shown here
options.colorScheme
Type: String Default value: paired12
A string value that allows you to change the graph colour scheme. You currently need to choose a scheme with at least 9 colours to ensure that all nodes are coloured. Colour schemes which include white or very pale colours will cause some nodes to be hard to see or appear invisible against the white background
colorScheme: 'set19'
Available graphviz colour schemes are shown here
Contributing
In lieu of a formal style guide, take care to maintain the existing coding style. Add unit tests for any new or changed functionality. Lint and test your code using Grunt .
List of Contributors
- lucalanca (current maintainer)
- carlo-colombo (initial creator of the project)
- g1ps
Release History
0.2.6
- (lucalanca) Moves grunt-graphviz from devDependencies to dependencies.
0.2.5
- (g1ps) fixes 0.2.4 build break
- (g1ps) Adds colour scheme as a configuration
0.2.4
- (g1ps) Separated the legend from the graphs.
- (g1ps) Added the ability to configure which shapes to use.


![[HBLOG]公众号](https://www.liuhaihua.cn/img/qrcode_gzh.jpg)

