使用 Bluemix Time Series Database 解释 syslog 文件
许多 UNIX® 和Linux® 的系统使用 syslog 文件存储来自不同子系统的日志消息。您通常可以在 /var/log/syslog 查看这个文件。通常,该文件还综合了来自不同主机的信息。
在执行故障诊断时,要确定最新的问题,只需逐行阅读该文件。然而,要一目了然地查看来自不同系统的信息,仪表板会很有用。在本文中,我将演示如何使用 Bluemix®、Node.js 和 Time Series Database 编写这样的仪表板。
构建您的应用程序需要做的准备工作
- 一个 Bluemix 帐户(注册您的免费试用版帐户,或者,如果您已经有一个帐户,请登录到 Bluemix)。
- HTML 和 JavaScript 的知识。
- MEAN 应用程序堆栈的知识(至少 Node.js 和 Express)。(如果不熟悉 MEAN,您可以从 IBM developerWorks 上的一篇由三部分组成的文章 “ 使用 Bluemix 和 MEAN 堆栈构建自助发表 Facebook 信息的应用程序 ” 开始了解 MEAN。)
- 一个可以将 Node.js 应用程序上传到 Bluemix 的开发环境,如 Eclipse 。
运行应用程序
获取代码
“ 在本文中,我会告诉大家如何在 Bluemix Time Series Database 中上传、解析和存储来自 UNIX syslog 文件的信息。我还会说明如何在该数据库上使用查询,创建一个仪表板,以图形方式显示来自该文件的信息。 ”
上传并解析 syslog 文件
文件被上传为一个表单中的字段。
客户端代码
要上传文件,采用的表单的方法必须是 post ,编码类型(加密类型)是 multipart/form-data 。
<form action="send-syslog" role="form" method="post" class="form-inline" name="syslogForm" enctype="multipart/form-data"> <div class="panel panel-primary"> <div class="panel-heading"> Submit your syslog file </div> <div class="panel-body">
下面是用于上传文件的输入字段。请注意 onChange 属性。 onChange 是一个 JavaScript 属性,当字段值发生变化时执行。在本例中,该文件是唯一的字段,因此它会自动提交表单。
<input type="file" name="syslog" id="syslog" onChange="syslogForm.submit()" /> </div> </div> </form>
服务器端代码
- 在服务器端,您需要将 multer 包 添加到 packages.json。您需要创建一个上传对象来使用它:
// Deal with multi part responses (such as file uploads) // The default for multer is to store files in memory, which is what we want // for this application.It is only temporary storage until the file is parsed // anyway. var upload = require("multer")(); - 然后,使用这个对象来创建中间件,并在
app.post()调用中使用这个中间件处理上传的文件。如果想要限制上传的文件,可将upload.any()调用替换为upload.single()或upload.array()。// upload.any() is used to handle any uploaded files app.post("/send-syslog", upload.any(), function(req, res) { - 然后,就可以在请求对象中使用上传的文件。在默认 multer 配置中,上传的文件被作为缓冲对象存储在内存中。使用
toString('utf8')函数将它们转换为一个字符串。res.send(req.files[0].buffer.toString('utf8')); });
解析 syslog 文件
syslog 文件是每行一个记录。每一行的格式是:
<Month> <day of the month> <time> <source computer> <component>[<pid>]:<message>
pid (进程标识符)字段是可选的;其他字段始终会出现。
- 要使用该信息,首先要将它拆分成多条记录。为此,需要将上传文件转换成一个字符串,并将它拆分成多个行。此代码还为记录初始化了一个空数组,并获取时间。
var string = req.files[0].buffer.toString('utf8'); var lines = string.split("/n"); var records = []; var now = new Date(); - 处理每一行。首先创建一个空记录。
// For every line for(var i=0; i<lines.length; i++) { var newRecord = {}; - 在 syslog 记录中的主要区分是冒号和空格前面的标识信息,以及它们后面的消息。请注意,在这里,您不能使用分割函数,因为后面跟一个空格的冒号可能会出现在消息中。
// The message after the colon should be kept as one piece. var colon = lines[i].indexOf(":"); newRecord.msg = lines[i].substring(colon+2); var data = lines[i].substring(0,colon); - 标识信息由一个或多个空格或制表符分隔。要分割它,可以使用正则表达式
/[ /t]+/。主机始终是第四个值。// The information before the colon follows a strict format and // can be further divided. var recordData = data.split(/[ /t]+/); newRecord.host = recordData[3];
- 该组件比主机更复杂一些。它可以只是一个组件名称,如
kernel。它也可以是组件名称加方括号中的进程 ID (pid) ,如avahi-daemon[1018]。必须区分这两种情况,分隔组件名称与 pid,并将信息放入新记录的正确字段中。// The component can have a PID in it. if (recordData.length >= 5) { var componentData = recordData[4].split("["); newRecord.component = componentData[0]; if (componentData.length > 1) { newRecord.pid = componentData[1].replace("]", ""); } } - 前三个字段是日期和时间。Syslog 是年代久远的产物,为了节省存储空间,它不包含年份;为了解决这个问题,假设条目指的是当前年份。如果在解析后,时间似乎是未来的时间,那么可以尝试使用前一个年份重新解析。
// Note that the result of Date.parse() is a number, not a Date object. // Also, syslog files do not contain the year.This code assumes // it is the current year, unless that would put it in the future. var dateStr = recordData[0] + " " + recordData[1] + " " + now.getFullYear() + " " + recordData[2]; newRecord.date = Date.parse(dateStr); if (newRecord.date > now) { dateStr = recordData[0] + " " + recordData[1] + " " + (now.getFullYear()-1) + " " + recordData[2]; newRecord.date = Date.parse(dateStr); } - 注意,存储在
newRecord.date中的日期值不是 Date 对象,而是一个数字(自历元开始的毫秒数)。要在显示记录的函数中格式化该数字,首先要将它转换回一个 Date 对象。res += "<td>" + new Date(records[i].date) + "</td>";
存储 syslog 条目
如果应用程序无法存储 syslog 文件,上传和解析都是没有 用的。要存储数据,请按照下列步骤进行操作:
- 在 Bluemix 中导航到 Data & Analytics > Time Series Database ,创建一个新服务。然后,把它绑定到您的应用程序。在应用程序中,该数据库信息以下列形式提供:
appEnv.services.timeseriesdatabase[0](假设只使用了一个 Time Series Database)。要查看这些详细信息,可以添加以下调用:app.get("/help", /* @callback */ function(req, res) { res.send(JSON.stringify(appEnv.services.timeseriesdatabase[0])); }); - 提供一个 JSON 解析器的 URL,比如 Freeformatter 网站上的 JSON formatter 。
订阅 developerWorks Premium ,在我们的定制 Safari 联机丛书库 (Safari Books Online library) 中阅读 “使用 MongoDB 和 Node.js 进行 Web 开发” 和 “使用 MEAN 堆栈编写现代 Web 应用程序:Mongo、Express、AngularJS 和 Node.js”。
在进入生产环境之前,记得注释掉这个调用;凭证应该是一个密码。该数据库有一个 MongoDB API,所以您可以将它用作 MongoDB 数据库。要了解关于使用 MongoDB 或者假装成 MongoDB 的数据库的更多信息,请参见 “ 使用 Bluemix 和 MEAN 堆栈构建自助发表 Facebook 信息的应用程序,第 2 部分 ” 中的步骤 2-4。
配置对 MongoDB API 的访问
在本文中,我会简单地复习一下访问 MongoDB 的步骤。若想了解更多信息,请参阅 “ 使用 Bluemix 和 MEAN 堆栈构建自助发表 Facebook 信息的应用程序,第 2 部分 ” 中的步骤 2-4。
- 将
MongoDB包添加到 packages.json。 - 添加以下代码,连接到数据库,并将
syslogCollection设置为 syslog 条目集合。如果它不存在,则会在第一次写入数据时创建它。
// Connect to the database var dbInfo = appEnv.services.timeseriesdatabase[0]; // If there is no MongoDB service, exit if (dbInfo == undefined) { console.log("No time series database to use, I am useless without it."); process.exit(-1); } // The variable used to actually talk to the database.It starts // as null until gives a usable value in the connect function. var syslogCollection = null; // Connect to the database. dbInfo.credentials.url contains the user name // and password required to connect to the database. require('mongodb').connect(dbInfo.credentials.json_url, function(err, conn) { if (err) { console.log("Cannot connect to database " + dbInfo.credentials.json_url); console.log(err.stack); process.exit(-2); } console.log("Database OK"); // Set the actual variable used to communicate with the collection.The collection // will be created if necessary. syslogCollection = conn.collection("syslog"); }); 写入 Time Series Database
- 添加以下函数,将数据插入
syslogCollection。因为在处理程序中只向syslogCollection提供了一个值,很可能在插入函数变得可用之前调用它。在这种情况下,系统会等待一秒钟,然后重试。// Insert data into the collection.If there is a next // function, call it afterwards var insertData = function(data, next) { // If the syslogCollection is not available yet, // wait a second and try again. if (syslogCollection === null) { setTimeout(function() {insertData(data, next);}, 1000); return ; } // Insert the data syslogCollection.insert(data, {safe: true}, function(err) { if (err) { // Log errors console.log("Insertion error"); console.log("Data:"+ JSON.stringify(data)); console.log("Stack:"); console.log(err.stack); } else // If no error, call next(); if (next !== null) next(); }); }; - 在此函数中,可以将
data存储为单个 MongoDB 文档的一个映射对象(包含键和值的一种结构),也可以将它存储为一系列文档的数组。为了获得更高的性能,通过在解析记录之后添加下列这行代码,只使用一个数组将该应用程序写入一次:insertData(records);
查询 Time Series Database
读取数据库
阅读 “ 使用 Bluemix 和 MEAN 堆栈构建自助发表 Facebook 信息的应用程序,第 2 部分 ” ,了解有关读取数据库的更多信息。
// Read data in the collection, run next on the result var readData = function(filter, next) { // If the syslogCollection is not available yet, // wait a second and try again. if (syslogCollection === null) { setTimeout(function() {readData(filter, next);}, 1000); return ; } // If we're successful, run next. syslogCollection.find(filter, {}, function(err, cursor) { if (err) { console.log("Search error"); console.log("Filter:"+ JSON.stringify(filter)); console.log("Stack:"); console.log(err.stack); } else cursor.toArray(/* @callback */ function(err, items) { next(items); }); // End of cursor.toArray }); // End of userCollection.find }; // End of readData app.get("/data", /* @callback */ function(req, res) { readData({}, function(allEntries) { res.send(allEntries); }); }); 提供信息
有两种方法可以将数据库中的信息提供给用户。第一种方法是,公开整个数据库来进行读查询。第二种方法是,处理服务器上的 syslog 信息;这种方法只向客户端上运行的应用程序提供摘要信息。
在大多数情况下,服务器端处理会更好一些,因为服务器到数据库的带宽更好,并且可能有更多的内存和更强的处理器。在本例中,我们使用仪表板来查找一段时间内的统计信息,该统计信息可能是每个记录的条目数量。
信息请求需要包含三个参数:
- 开始时间。
- 结束时间。
- 划分时间段的分割数。例如,这对获得相对于时间的信息很有用。
- 最简单的信息请求方式是 HTTP 请求。在该应用程序中,我选择使用路径
/stats,然后是三个参数(开始时间、结束时间和分割数)。当一个路径组件中有冒号前缀时,该组件被解释为参数,参数值是在req.params中提供的。参数值是字符串,所以我用parseInt将它们转换为整数。// Get statistics about the syslog entries between two times app.get("/stats/:from/:until/:divisions", function(req, res) { // Keep the from and until times as numbers. var from = parseInt(req.params.from, 10); var until = parseInt(req.params.until, 10); var divisions = parseInt(req.params.divisions, 10); - 接下来,为所有时间段创建容器,并计算每个时间段的开始 时间和结束时间。
// The length of each period in the results var periodLength = (until-from)/divisions; // calculate the periods for the result "buckets" var results = new Array(divisions); var tasks = new Array(divisions); for(var i=0; i<divisions; i++) { results[i] = {}; // Initialize to an object. results[i].from = from + i*periodLength; results[i].until = from + (i+1)*periodLength; - 您只关心在该时间段中的数据,所以应该为 MongoDB 创建适当的筛选器。MongoDB 筛选器是一些结构,它们采用字段名作为键,采用筛选器表达式作为值。在本例中,只有一个参数,
date。您希望它在results[i].from和results[i].until之间。所采用的指定方法是,将值指定为具有不同表达式的对象。在本例中,date的值将被表达为>= results[i].from和< results[i].until。MongoDB 没有使用正常的运算符(必须用引号括起来),而是使用$gt、$lt,依此类推。参见 MongoDB 网站上的 查询选择器 的列表。var timeFilter = { date:{ $gte: results[i].from, $lt: results[i].until } }; - 下一步是调用
readData函数来检索信息。不过,您需要多次调用它,对每个时间段都调用一次,然后一起报告所有调用结果。在 Node.js 这样的异步框架中,这种工作并不轻松。一种解决方案是使用 异步包 ,它支持各种形式的异步执行。Node.js 是单线程的,因此不同的函数无法 真正 并行运行。但是,在某个函数运行的时候,让其他函数同时等待一个事件(来自 I/O 或定时器都可以),就有可能让异步执行变得像是并行运行一样。要运行多个函数,在编写所有函数时,应该让它们都接受由下一个函数调用的参数,并将这些参数放在一个数组中。调用
async.parallel时使用了两个参数:函数数组和在数组中所有函数完成之后运行的一个回调。在本例中,因为 JavaScript 将值绑定到变量的方式,构建数组并不简单。调用函数时,默认情况下会使用当前值。如果在一个循环中创建相同函数的数组,只是采用了不同的参数,那么在函数被执行的时候,这些参数将获得相同的值。一个可能的解决方案是使用 绑定函数 ,将当前值绑定到对当前函数可用并具有正确值的
this对象。tasks[i] = function(next) { readData(this.filter, function(data) { console.log(data.length); this.result.stats = countStats(data); next(); } .bind({result: this.result}) ); } . bind({ i: i, filter: timeFilter, result: results[i] }); } - 为了获得统计信息,必须计算在某个时间段中,每个成对出现的主机和组件在数据中出现的次数。以下函数列出了您将如何执行此操作:
// Increment the count for a key in a structure.If the key // is not there yet, create it with one. var incrementKeyInStruct = function(struct, key) { if (struct[key] == undefined) struct[key] = 1; else struct[key] ++; }; // Count how many times each host, component, and (host, component) pair appears in // the data, and return a structure with that information.Add the total number of events var countStats = function(data) { var result = { host_n_component:{}, host:{}, component:{}, total: data.length }; for(var i=0; i<data.length; i++) { incrementKeyInStruct(result.host_n_component, data[i].host + "," + data[i].component); incrementKeyInStruct(result.host, data[i].host); incrementKeyInStruct(result.component, data[i].component); } return result; }; - 除了每个时间段的值,总计值也是有用的。下面的代码包含了如何查看总计值。
// Add numbers in a structure to the totals in a separate structure var add2Total = function(source, totals) { var keys = Object.keys(source); for (var i=0; i<keys.length; i++) { if (totals[keys[i]] == undefined) totals[keys[i]] = source[keys[i]]; else totals[keys[i]] += source[keys[i]]; } }; // Get the totals per host and per component var getTotals = function(results) { var host = {}; var component = {}; var host_n_component = {}; console.log(results.length); console.log(results[0].stats); for(var i=0; i<results.length; i++) { add2Total(results[i].stats.host, host); add2Total(results[i].stats.component, component); add2Total(results[i].stats.host_n_component, host_n_component); } return { host: host, component: component, host_n_component: host_n_component }; }; - 所有准备都已就绪,可以运行查询数据库的函数, 并返回 JSON 格式的结果:
async.parallel(tasks, /* @callback */ function(err) { res.send(JSON.stringify({ results: results, totals: getTotals(results) })); });
以图形方式显示结果
服务器端应用程序的目的就是让统计信息可以显示在浏览器上。像往常一样,我使用了 Angular 库和 Bootstrap 主题。
获取信息
Angular 自带一个名为 $http 的服务,顾名思义,它是一个 HTTP 客户端。要使用 $http 服务,必须将该服务用作创建控制器的函数的一个参数:
myApp.controller("myCtrl", function($scope, $http) { 获得统计数据的代码在一个函数里面,因为,如果时间段改变了,则需要再次调用它;这个函数首先获取 URL。为了简便起见,我选择始终划分成二十个时间段,但更聪明的应用程序可能会根据窗口的宽度来决定如何划分时间段。不需要指定主机,因为它就是获得仪表板的浏览器所在的主机。
var url = "stats/" + $scope.from.getTime() + "/" + $scope.until.getTime() + "/20";
对 $http 的调用返回一个承诺对象,其中有一个 then 方法,在成功(第一个参数)或错误(第二个参数)的情况下,函数都会调用它。
$http({ method :"GET", url : url }).then(function(response) { // Note that response.data is already parsed by the $http package. $scope.data = response.data; $scope.drawGraphs(); $scope.hosts = Object.keys($scope.data.totals.host); $scope.components = Object.keys($scope.data.totals.component); }, function(response) { alert("Error:" + response.statusText); }); 如果请求成功,函数会将响应数据(已解析)复制到作用范围,然后调用绘制图形的函数,并更新一些数据结构。
基本图表
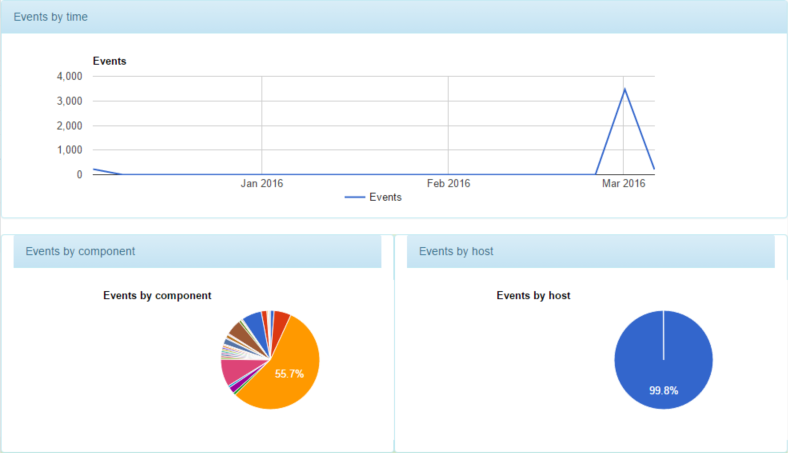
基本图表将会按时间显示所有事件(线图),以及来自每个主机和每个组件的事件数量(两个图都是饼图)。


对于图表,这个应用程序使用了 Google 图表包 。直接从服务器所提供的值提取相关的信息。
只有两个小问题:
- 首先,这些值是包含键的结构,而不是 Google 图表包所预期的数组的数组。这可以通过
$scope.struct2Data(title, struct)函数对键进行迭代来解决:// Organize the data for a pie chart out of a structure $scope.struct2Data = function(title, struct) { var dataArray = [[title, "Number of events"]]; var keys = Object.keys(struct); for(var i=0; i<keys.length; i++) dataArray[dataArray.length] = [keys[i], struct[keys[i]]]; return google.visualization.arrayToDataTable(dataArray); }; - 其次,在时间线图上,事件的每个时间段的开始时间是一个时间戳,即自历元开始以来的毫秒数。为了得到有用的时间值,必须将它们转变成
Date对象。// Create the data array from the data for(var i=0; i<$scope.data.results.length; i++) dataArray[dataArray.length] = [new Date($scope.data.results[i].from), $scope.data.results[i].stats.total];
用户选择的图表
用户通常希望只看到一个信息子集。为此,仪表板包括两列复选框,一列用于主机,另一列用于组件。仪表板还显示了饼图,只显示来自选定主机和组件的事件。


使用此 Angular 代码创建两个复选框列:
<div class="col-md-3"> <h4>Hosts:</h4> <div ng-repeat="host in hosts"> <input type="checkbox" ng-model="hostsToShow[host]">{{host}}</input> </div> </div> <div class="col-md-3"> <h4>Components:</h4> <div ng-repeat="component in components"> <input type="checkbox" ng-model="componentsToShow[component]">{{component}}</input> </div> </div> 复选框中的值被存储在两个结构中: hostsToShow 和 componentsToShow 。每次选中复选框时,该值都会更改为 true。在取消选中时,该值被更改为 false。因此,对于未被选中的主机或组件,有两种可能性。当任一结构变更时,必须重新绘制子集饼图。
Angular 为我们提供了一个函数 $scope.$watch ,让我们在范围变量发生更改时注册一个处理程序。
// When hostsToShow or componentsToShow change, redraw the graphs that depend on them. $scope.$watch('hostsToShow', function(newVals, oldVals) { $scope.redrawSubset(); }, true); $scope.$watch('componentsToShow', function(newVals, oldVals) { $scope.redrawSubset(); }, true); 最后, $scope.redrawSubset() 函数重新绘制了两个饼图,一个用于主机,一个用于组件,它们只显示了子集。
// Redraw the subset data, the partial data (only for selected hosts and components) $scope.redrawSubset = function() { var hostTotals = {}; var componentTotals = {}; for (var name in struct) {} 语法允许我们遍历结构中的每一个键。然而,其中一些键的值可能是 false(因为该键被选中,然后被清除)。只有当前被选中的那些键才是相关的。
// For every host and component that are selected for(var host in $scope.hostsToShow) if ($scope.hostsToShow[host]) // If it is selected and // then deselected, it would // appear, but as false.Remove // those values for (var component in $scope.componentsToShow) if ($scope.componentsToShow[component]) { 如果有针对该主机/组件的任何事件,它们的数据结构为 totals.host_n_components 。需要通过使用 add2Struct 函数,将这些主机/组件对事件添加到主机和组件的总计。
// Add the events to the two totals counters var value = $scope.data.totals.host_n_component[host + "," + component]; add2Struct(host, hostTotals, value); add2Struct(component, componentTotals, value); }
add2Struct 函数将一个值添加到总计,在必要时创建键。
// Add a value to a field in a structure.If the field is missing, create it. var add2Struct = function(key, totals, value) { if (value == undefined) return; if (totals[key] == undefined) totals[key] = value; else totals[key] += value; }; 最后,重绘这部分数据的饼图。
var hostData = $scope.struct2Data("Host", hostTotals); var hostOptions = { title:'Events by host (selected hosts and components only)' }; new google.visualization.PieChart(document.getElementById( 'pie-host-selected')).draw(hostData, hostOptions); var componentData = $scope.struct2Data("Host", componentTotals); var componentOptions = { title:'Events by component (selected hosts and components only)' }; new google.visualization.PieChart(document.getElementById( 'pie-component-selected')).draw(componentData, componentOptions); 结束语
此应用程序中的仪表板是一个简化版本,因为我们的目的是教学,而不是构建一个实用的应用程序。对于生产版本,您可能想添加许多特性:
- 添加多租户。现在,所有用户都可以查看所有的数据,这显然不是理想情况。对用户进行身份验证会更好一些,具体说明请参阅 “ 将 Google reCAPTCHA 添加到您的 Bluemix Node.js 应用程序 ” 中 “配置单点登录服务” 一节的内容。然后,您可以向每个用户显示他/她自己的数据,这需要在
insertData中为用户添加一个额外的字段,并在 app.js 第 330 行上增加一个用户筛选器timeFilter。 - 添加一个图表,显示所选主机和组件在不同时间的事件,类似于显示所有事件的图表。服务器已经在
results[period].stats.host_n_component中提供了所有必要的信息。您只需要为每个主机和每个组件计算相关的对的总数,就像在$socket.redrawSubset()中执行的那样。 - 在时间图表中添加交互能力,让用户可以进行缩放,还能够手动指定时间限制。
BLUEMIX SERVICE USED IN THIS TUTORIAL: Time Series Database 服务 整合并组织了大量有时间标记的数据,实现了一致的快速分析。
相关主题: Time Series Database Google 图表包 MongoDB
- 本文标签: IDE 主机 空间 处理器 web ip json cat Developer Google 文章 解析 tab tar onchange 数据 ask 注释 JavaScript java eclipse Select 进程 AngularJS API ACE MongoDB unix 组织 UI 统计 时间 Security 正则表达式 Document db 线程 setTimeout Facebook Word HTML Service 定制 js value 配置 src 代码 message linux parse node 数据库 开发 Bootstrap http App Action 服务器 struct key 网站 lib Node.js 免费 遍历 IBM find 参数
- 版权声明: 本文为互联网转载文章,出处已在文章中说明(部分除外)。如果侵权,请联系本站长删除,谢谢。
- 本文海报: 生成海报一 生成海报二


![[HBLOG]公众号](https://www.liuhaihua.cn/img/qrcode_gzh.jpg)

