基于heatmaply和plotly的交互式热力图
手把手做个新鲜出炉的网页交互热图
Interactive Heatmap
利用R绘制热力图比较简单,而随着可视化工具喷涌,交互式热力图在R中的实现也常见起来。以前有heatmap包,d3heatmap包,今天则出现了干脆利落的heatmaply包(我喜欢)。
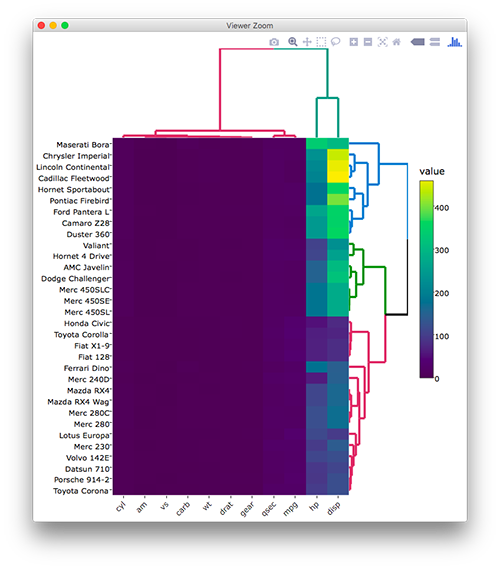
新包作者Jonathan Carroll基于gglot2和plotly.js开发了这一款新包,并且可以完美的运行在各个端口。如下图,用老家伙mtcars生成了内嵌在网页中的交互热力图。
而当我们运行下方的代码时,在Rstudio中会出现同样的效果:
install.packages("heatmaply")
library(heatmaply)
heatmaply(mtcars, k_col = 2, k_row = 3) %>% layout(margin = list(l = 130, b = 40))
heatmap-r

Do It Yourself
1. 安装相关的包:作者提供了以下两种安装方式
#1-稳定版本的
install.packages("heatmaply")
#2-github开发版
#先安装或者运行
install.packages('installr'); install.Rtools()
#安装devtools
install.packages.2 <- function (pkg) if (!require(pkg)) install.packages(pkg)#制定函数
install.packages.2('devtools')
devtools::install_github("ropensci/plotly")
devtools::install_github('talgalili/heatmaply')
随后开始运行
library(heatmaply)
heatmaply(mtcars)
heatmaply(mtcars, k_col = 2, k_row = 3) %>% layout(margin = list(l = 100, b = 100))
#k_col、k_row设定色彩种类,数值不应该超过所涉变量的范围
#Pipe操作连接margin函数以调整显示尺寸
heatmaply(cor(mtcars), k_col = 2, k_row = 2,limits = c(-1,1)) %>% layout(margin = list(l =
40, b = 40),colors = heat.colors(100))
#插入相关系数函数作为热力数值,limits作为显示范围从负相关到正相关.colors函数用以调整色彩,其他命令如下
heatmaply(cor(mtcars),
scale_fill_gradient_fun = ggplot2::scale_fill_gradient2(low = "blue",
high = "red", midpoint = 5, limits = c(-1, 1)),k_col = 2, k_row = 3) %>% layout(margin =
list(l = 100, b = 100))
基本上,这些代码已经可以在R实现交互式热力图了。下面的问题是如何在网页端中实现?
Plotly For R
终于轮到Plotly出场了。
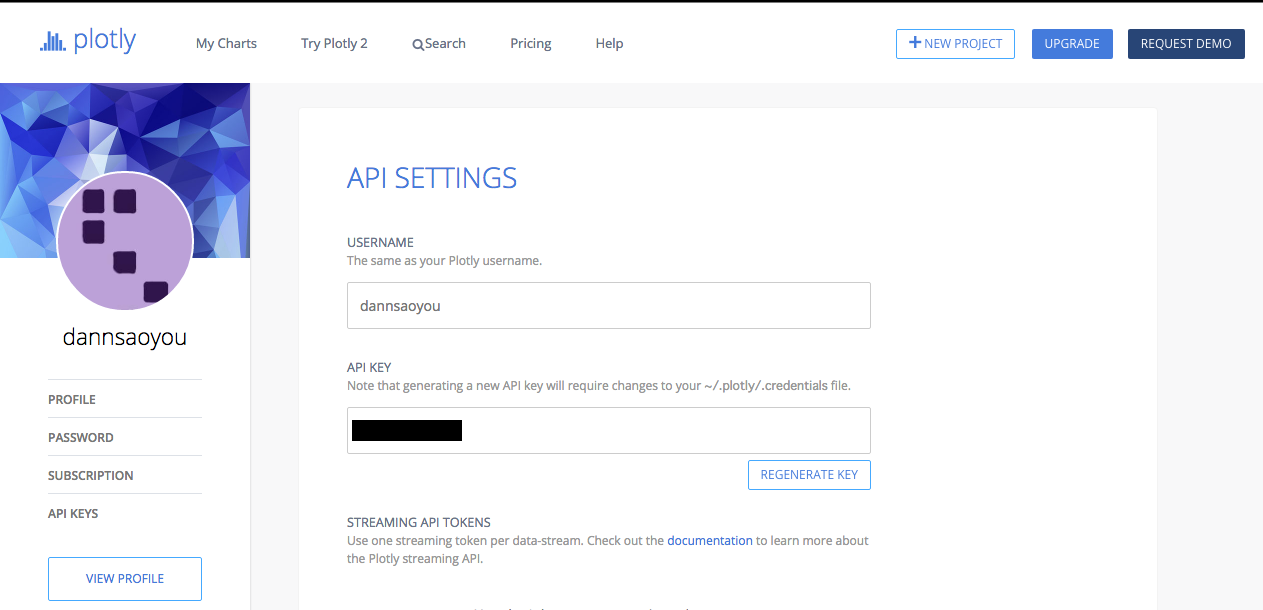
首先需要注册一个Plotly网站的帐号,注册成功后,进入到个人页面(profile)中,点击API Keys产生自己的钥匙。

之后,就可以回到R部署所需的包:
install.packages("plotly")
library(plotly)
plotly_username="******"#你的用户名
plotly_api_key="*****"#你的API
library(heatmaply)#加载heatmaply包
a<-heatmaply(mtcars, k_col = 2, k_row = 3) %>% layout(margin = list(l = 130, b = 40))
plotly_POST(a, filename = "heatmap", fileopt = "new",sharing = "public")
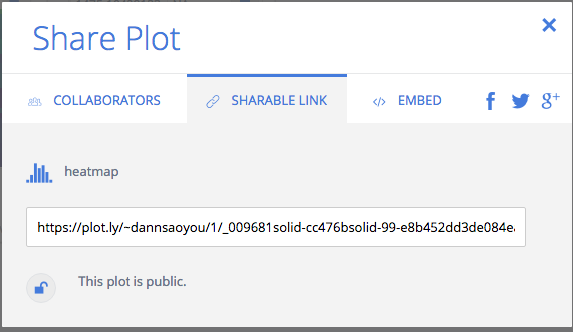
到此,plotly就已经成功上传了你的作品。然后回到自己的页面,就会看到已经出现的分享页面

选择iframe格式,就可以轻松把他们插入到自己的页面了。如下是我生成的页面:
Over
欢迎加入本站公开兴趣群
商业智能与数据分析群
兴趣范围包括各种让数据产生价值的办法,实际应用案例分享与讨论,分析工具,ETL工具,数据仓库,数据挖掘工具,报表系统等全方位知识
QQ群:81035754


![[HBLOG]公众号](https://www.liuhaihua.cn/img/qrcode_gzh.jpg)

