探索 Web 自动化测试中 Selenium 对 Dojo Chart 的支持和应用
前言
在当今的大数据时代,为了让用户更快速更直观的了解数据信息,在 Web 应用中使用各种图表来实现数据的可视化显示成为更多项目的首选,Dojo Chart 的动态绘图功能提供了众多的图表类型,如饼状图,柱状图,点线图等等,为可视化的 Web 应用开发者提供了诸多方便。
然后对于测试者来说,想要实现对各种 Dojo Chart 的自动化测试,这些矢量图可太让人头疼了,仅仅是元素定位,就让人无从下手,没有固定的 ID,没有 class,没有 name,使用万能的 XPath 吧,在 Firebug 里面都定位不到,更别提写自动化测试代码了。
本人也是上网查询了无数的相关文章,咨询了很多位自动化测试专家,由于前辈们对 Dojo Chart 矢量图自动化测试这一领域的经验欠缺,无奈苦寻无果,曾一度令自己的自动化工作停止,直到某一天得到某位高人的指点,经过自己的探索和研究,终于成功的将这一难题拿下,于是准备写篇文章,将自己的经验分享给大家。
元素定位的基本方式
在开始本节的内容之前,让我们先来回顾一下,在使用 Selenium WebDriver 进行元素定位时最常用的几种方式,以及使用他们的优缺点:
- By.id(String id) – 通过元素的 id 属性来查找元素,是最直接有效的定位方式,但是在很多实际项目中,给每个元素都赋予固定的 id 几乎是不可能完成的工作,所以还要借助其他的定位方法。
- By.name(String name) –通过元素的 name 属性来查找元素,实际项目中有 name 属性的元素较少,所以此方法使用的较少。
- By.tagName(String tagName) –通过元素的标签名称来查找元素,通常标签名称重复的元素比较多,所以该方法一般用于返回一个元素集。
- By.className(String className) –通过元素的 css 样式表所引用的伪类名称来进行元素查找。
- By.linkText(String text) - 通过超文本链接上的文字信息来定位元素,这种方式一般专门用于定位页面上的超文本链接。
- By.partialLinkText(String partText) -通过超文本链接上的部分文字信息来定位元素。
- By.xpath(String xpathExpression) – 利用 XPath 表达式来定位元素,是个非常强大的元素查找方式,几乎可以定位到页面上的任意元素,缺点是脚本中如果大量使用 XPath 做元素定位的话,将导致脚本执行速度大大降低。
- By.cssSelector(String cssSelectorExpression) – 与 XPath 定位比较类似,也是一个非常强大的元素查找方式,执行速度较快。
Dojo Chart 在 Web 项目中的应用
在当前的大数据时代,为了将枯燥无味的大量数据更生动的展现给用户,很多 Web 系统中都会用到一些统计图,例如饼状图,柱状图、趋势图、以及叠加图等,当前正流行的 Dojo 就拥有强大的 web 开发控件库,有着一个专门针对 web 矢量图开发的控件包"dojox.charting",提供了一套很完善的统计图 (Chart) 接口。
下面我们将展示出几个矢量图的应用实例:
图 1. 饼状图
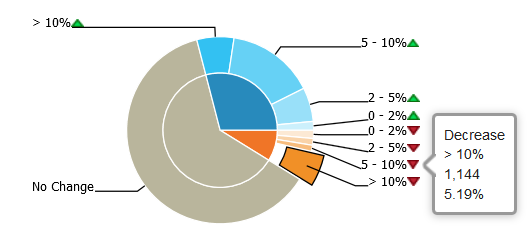
在饼状图中,当鼠标在它的其中一个部分上悬停时,这一部分将会呈现出扩展的样式并且有提示信息浮现,我们截取这一扩展部分在 HTML 里面的位置,如图 2 所示:
图 2. 饼状图在 HTML 里面的结构
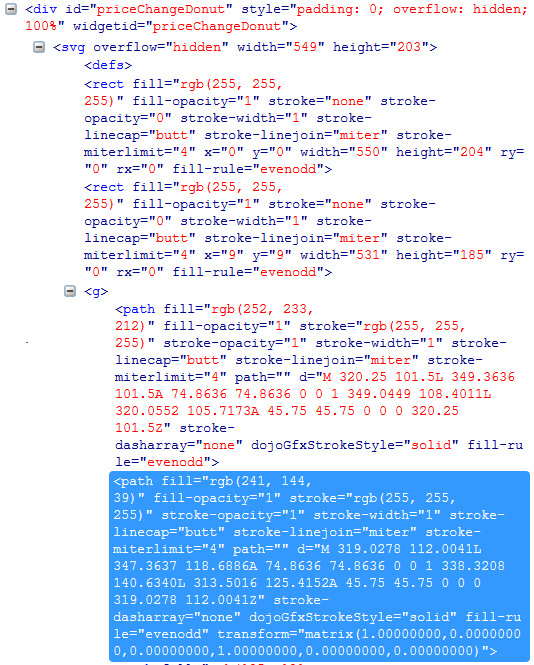
在饼状图的 HTML 结构中,我们发现鼠标悬停的这一部分是一个标签为 path 的元素,它既没有 id 属性,也没有 name 或者 class 属性,又不是一个超链接,那么思考一下是否可以通过 tagName 或者 XPath 来定位元素呢?
图 3. 柱状图
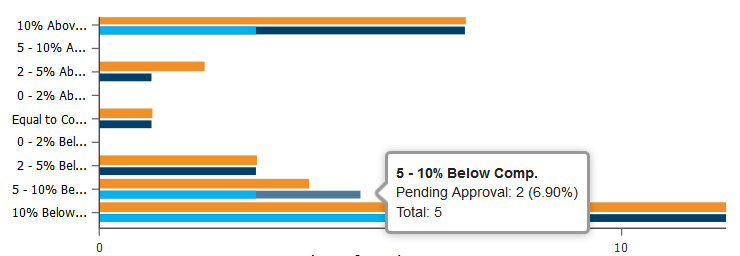
同样在柱状图中,当我们把鼠标悬停在其中一个柱状条的深蓝色部分时,这个深蓝色的柱条会呈现出高亮的颜色,并且有提示信息浮现,我们截取柱条的这一深蓝部分在 HTML 中的结构,如图 4 所示:
图 4. 柱状图在 HTML 中的结构
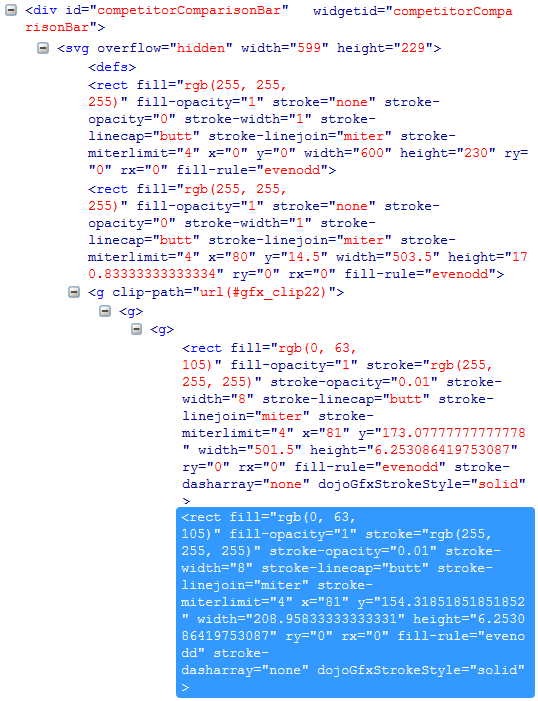
同理,柱状图在 HTML 里面的结构,鼠标悬停的深蓝色部分是一个标签为 rect 的元素,面临着同样的元素定位的问题。
基于 Dojo Chart 的元素定位
下面我们来研究一下统计图的元素定位的问题,基于他们在 HTML 里面的结构分析,我们首先将不可用的几种元素定位方法排除之后,将研究对象放在利用 tagName 和 XPath 两种方法上。
首先我们尝试一下利用 tagName 来查找元素:
清单 1. 利用 tagName 来查找元素
import java.util.List; import org.openqa.selenium.By; import org.openqa.selenium.WebDriver; import org.openqa.selenium.WebElement; import org.openqa.selenium.firefox.FirefoxDriver; public class LocalTest { public static void main(String[] args) { WebDriver driver = new FirefoxDriver(); //直接打开可以看到统计图的连接地址 driver.get("https://localhost/test/dojostack.dt?dojopagename=dashboard"); driver.manage().window().maximize(); //通常情况下 Dojo 页面是以 iframe 的形式嵌套在 HTML 中的,所以要先进入 iframe WebElement iframe = driver.findElement(By.xpath("//iframe[@src='/test/dashboard.dt']")); driver.switchTo().frame(iframe); //尝试寻找所有标签名字为 path 的元素,然后打印出个数 List<WebElement> elements = driver.findElements(By.tagName("path")); System.out.print(elements.size()); driver.quit(); } }结果令人吃惊的是,控制台的日志返回了 21,这说明虽然利用 tagName 可以找到统计图的元素,但是由于相同标签名字的元素太多,我们不得不通过层级定位来一步一步的查找到我们的目标元素,显然这将是个繁琐的查询过程,所以果断放弃 tagName 这一方式。
那么通过 XPath 或者 cssSelector 来查找是否可以呢?由于本人对 XPath 的偏爱,所以选择从这里下手研究。
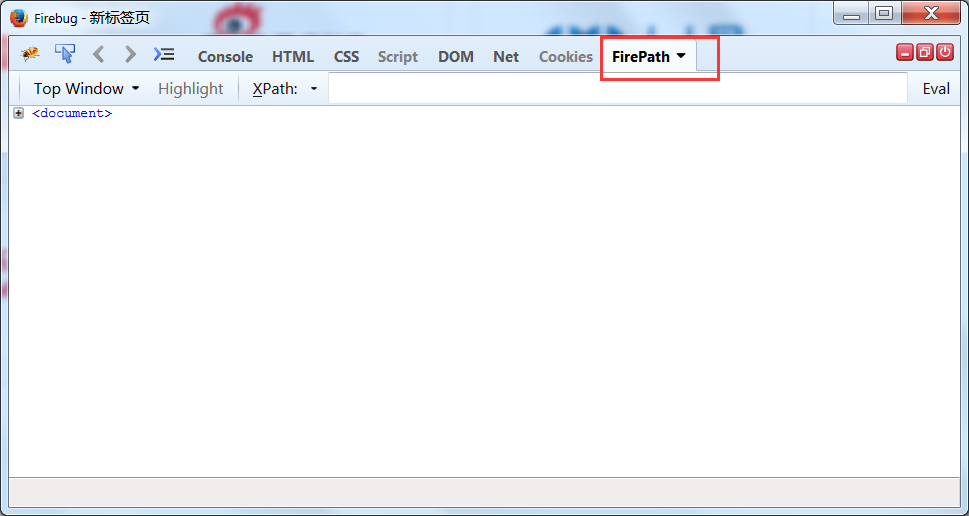
什么是 XPath?简单来说,XPath 是一门在 XML 文档中查找信息的语言,用于在 XML 文档中通过元素和属性进行导航。它的表达式语法在这里就不详细介绍了,网上有详细的教程,对于自动化测试来说,不需要了解高深的 XPath 表达式书写,只需要了解它的基本语法就可以,我们还可以借助一个小工具 FirePath,用来展示所选元素的 XPath,或者是对一个 XPath 表达式做验证,FirePath 是基于 Firebug 的一个小插件,装完之后,你将在 Firebug 的标签栏找到它,如下图:
图 5.FirePath 在 Firebug 中的位置
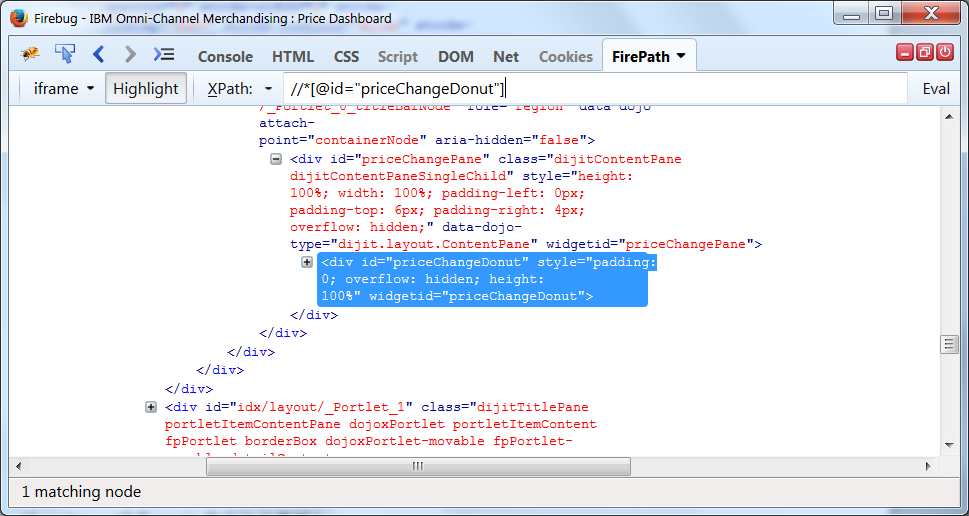
下来我们验证一下利用 XPath 来定位 Dojo Chart 中的元素是否行得通,通过观察饼状统计图的 HTML 结构,我们可以看到 svg 元素的一个父节点 div 是有个 id 属性的,那么我们首先用 XPath 定位到 svg 的父节点“//div[@id='priceChangeDonut']”,通过在 FirePath 里面验证,svg 的父节点是可以定位得到的,如图:
图 6. 有 ID 属性的 DIV 节点在 FirePath 中的查询结果
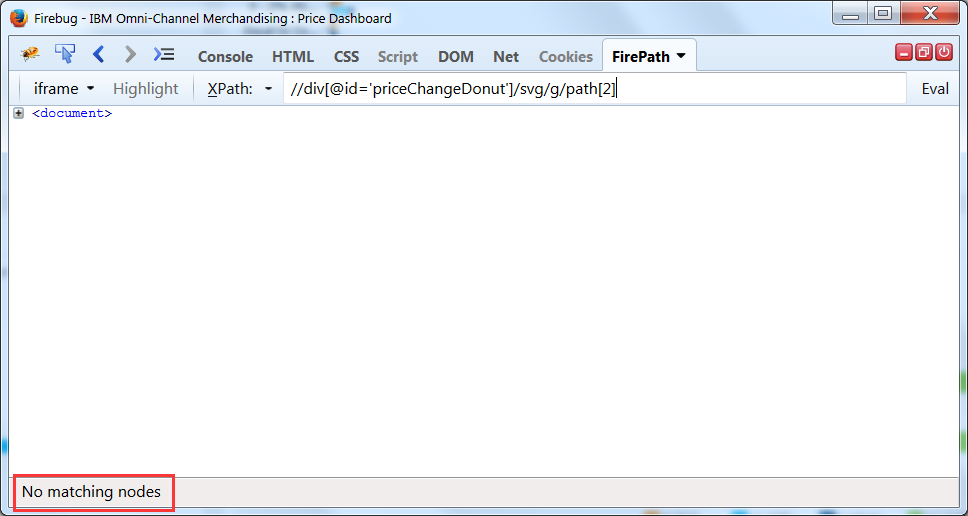
然后我们再来看看 path 标签用表达式“//div[@id='priceChangeDonut']/ svg/g/path[2]”是否可以定位到,尝试在 FirePath 里面验证这个 XPath 表达式,发现根本没有任何元素返回,如图:
图 7. 包含 Dojo Chart 元素的节点在 FirePath 中的查询结果
问题来了,难道 XPath 不能识别矢量统计图的标签?不应该的呀,在本人的心目中,万能的 XPath 可是无所不能的呀,于是接下来经历了大量的尝试,终于发现既然 XPath 不能直接识别矢量图的标签,但是我们还是可以绕开它的,比如我们换成这种表达式:"//div[@id='priceChangeDonut']/ *[name()='svg']/ *[name()='g']/ *[name()='path'][2]",在 FirePath 里面经过验证,这个表达式是可以定位到目标元素的,如图:
图8.改进版包含Dojo Chart元素的节点在FirePath中的查询结果
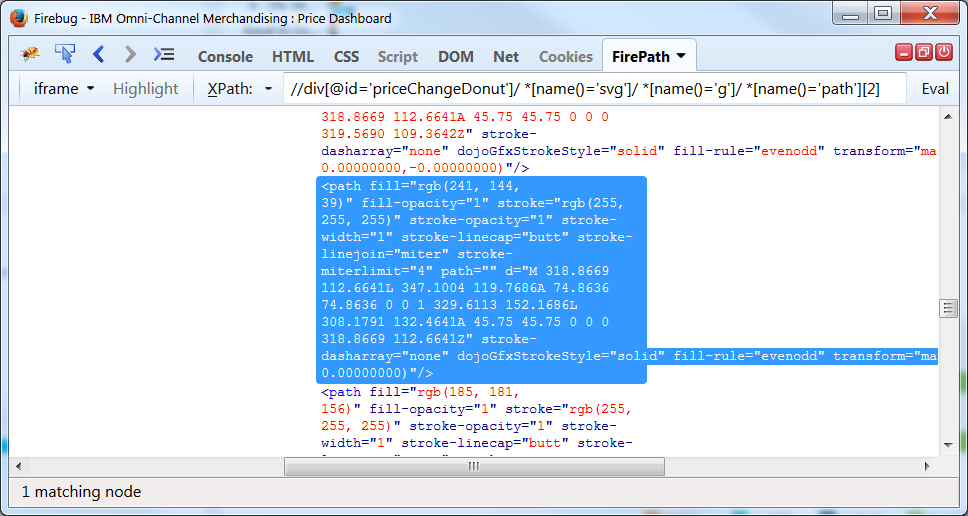
这说明通过 XPath 来定位 Dojo Chart 的元素是行得通的。
然而由于 Dojo Chart 的动态性,每次的统计图都是根据后台的数据更新而重新渲染的,新的问题又出现了,我们可能并不清楚我们所要查到的目标元素在下一次渲染中是否还是处于 HTML 结构中的同一位置,如果位置有变化,那么我们利用同样的 XPath 有可能定位不到元素,或者定位到的是错误的元素,显然我们需要一些改进。
实现 Dojo Chart 元素的动态查找
要想更稳定更准确的定位 Dojo Chart 的矢量图元素,我们必须实现对元素的动态查找,下面我们结合实例,针对具体的问题给出具体的解决方案。
饼状图的解决方案
我们先看图 1 中的饼状图并结合它在 HTML 中的结构,发现以下几个特征:
- 饼状图的每个切片部分在 HTML 中的标签名字是 path,当饼状图只有一个切片,也就是成为一个圆时,它的切片在 HTML 中的标签名字是 circle。
- 饼状图的每个切片的颜色都不同,这个颜色是 Dojo Chart 在后台自动算出来的,并且某个颜色代表的数据是固定的。
- 饼状图有内圈和外圈两个部分组成,所以内圈切片和外圈切片在 HTML 中的位置处于不同的层次。
基于我们的分析,我们可以运用这样的逻辑来动态查找切片:
- 首先判断当前的饼状图是有多个切片还是只有一个切片的圆。
- 其次根据预期的数据得出我们要查找的切片颜色。
- 遍历饼状图的内圈和外圈,确定预期的切片的唯一位置。
- 返回唯一的切片元素。
根据这样的逻辑,我们写出了以下可行的代码,如清单 2 所示:
清单 2. 饼状图动态查找实现方式
清单 2. 饼状图动态查找实现方式
import java.util.List; import org.openqa.selenium.WebElement; import org.openqa.selenium.By; import org.openqa.selenium.WebDriver; public class DonutChart { public static WebDriver driver; public static final String noChange = "No Change"; public static final String increase = "Increase"; public static final String decrease = "Decrease"; public static final String percentage0To2 = "0 - 2%"; public static final String percentage2To5 = "2 - 5%"; public static final String percentage5To10 = "5 - 10%"; public static final String percentage10 = "> 10%"; public static final String noChangeColor = "rgb(185, 181, 156)"; public static final String increaseColor = "rgb(40, 138, 188)"; public static final String decreaseColor = "rgb(240, 117, 39)"; public static final String increase0To2Color = "rgb(204, 240, 252)"; public static final String increase2To5Color = "rgb(153, 224, 249)"; public static final String increase5To10Color = "rgb(102, 209, 245)"; public static final String increase10Color = "rgb(51, 193, 242)"; public static final String decrease0To2Color = "rgb(252, 233, 212)"; public static final String decrease2To5Color = "rgb(249, 211, 169)"; public static final String decrease5To10Color = "rgb(247, 188, 125)"; public static final String decrease10Color = "rgb(241, 144, 39)"; public static final String outerRingLocator = "//div[@id='emx_eChart_eChart_0']/ div[@class='emxChartWrapper']/*[name()='svg']/*[name()='g'][1]"; public static final String innerRingLocator = "//div[@id='emx_eChart_eChart_0']/ div[@class='emxChartWrapper']/*[name()='svg']/*[name()='g'][2]"; public WebElement findSliceByColor(String ringLocator, String sliceColor) { String firstChildLocator = ringLocator + "/*[1]"; WebElement firstChild = driver.findElement(By.xpath(firstChildLocator)); //首先判断当前的饼状图是有多个切片还是只有一个切片的圆 if (firstChild.getTagName().equalsIgnoreCase("circle")) { //如果第一个切片的标签名字是 circle,说明这是个圆,圆只有一个切片 if (sliceColor.equalsIgnoreCase(firstChild.getAttribute("fill"))) { return firstChild; } else { return null; } //如果第一个切片的标签名字不是 cricle,说明将有多个切片存在 } else { List<WebElement> children = driver.findElement(By.xpath(ringLocator + "/*[starts-with(@fill,'rgb')]")); //遍历所有切片的属性,找到目标切片,并返回 for (int i = 1; i <= children.size(); i++) { WebElement currentChild = driver.findElement(By.xpath(ringLocator + "/*[starts-with(@fill,'rgb')]" + "[" + i + "]")); String currentColor = currentChild.getAttribute("fill"); if (sliceColor.equalsIgnoreCase(currentColor)) { return currentChild; } } } return null; } }柱状图的解决方案
我们再看看图 3 中的柱状图并结合它在 HTML 中的结构,发现以下几个特征:
- 柱状图的每个柱条部分在 HTML 中的标签名字都是 rect。
- 基于左侧 Y 轴的标签分类,每个标签下的柱条的颜色不同,但是在不同标签中柱条的颜色可能会相同。
- 相同颜色的柱条在 HTML 中属性是一样的,仅仅是节点位置不同。
基于我们的分析,不难看出,要想在柱状图中唯一定位一个元素比在饼状图中要艰难,仅仅根据节点位置来定位元素是不可靠的,我们还要寻找一个能唯一识别元素的属性,比如说鼠标悬停时弹出的提示信息。那么我们可以运用这样的逻辑来动态查找柱条:
- 首先根据预期的数据得出我们要查找的目标柱条颜色。
- 其次遍历所有标签中和目标颜色相同的柱条,并且鼠标悬停并获取提示的文本内容。
- 截取可用的文本部分用来和预期的数据做对比。
- 筛选出唯一的柱条元素并返回。
根据这样的逻辑,我们写出了以下可行的代码,如清单 3 所示:
清单 3. 柱状图动态查找实现方式
清单 3. 柱状图动态查找实现方式
import java.util.List; import org.openqa.selenium.WebElement; import org.openqa.selenium.interactions.Actions; import org.openqa.selenium.By; import org.openqa.selenium.WebDriver; public class BarChart { //所有柱条的颜色 public static final String pendingColor = "rgb(0, 63, 105)"; public static final String approvedColor = "rgb(0, 178, 239)"; public static final String previousColor = "rgb(241, 144, 39)"; public static final String pendingHighlightColor = "rgb(76, 120, 150)"; public static final String approvedHighlightColor = "rgb(128, 222, 255)"; //所有柱条的标签属性 public static final String aboveComp10 = "10% Above Comp."; public static final String aboveComp5To10 = "5 - 10% Above Comp."; public static final String aboveComp2To5 = "2 - 5% Above Comp."; public static final String aboveComp0To2 = "0 - 2% Above Comp."; public static final String equalToComp = "Equal to Comp."; public static final String belowComp10 = "10% Below Comp."; public static final String belowComp5To10 = "5 - 10% Below Comp."; public static final String belowComp2To5 = "2 - 5% Below Comp."; public static final String belowComp0To2 = "0 - 2% Below Comp."; //在柱状图中查找某个特定的柱条元素并返回 public WebElement findBar(String barColor, String barLabel) { WebElement targetBar = null; String targetBarLabel = null; String targetBarStatus = null; String barStatus = getBarStatus(barColor); //获取预期柱条的状态属性 //根据预期柱条的颜色来确定其在 HTML 中的节点位置 if (barColor.equalsIgnoreCase(pendingColor)) { String pendingBarsLocator = "//div[@id='emx_eChart_eChart_1']/div [@class='emxChartWrapper']/*[name()='svg']/*[name()='g'] [1]/*[name()='g']/*[name()='g'][1]/*[name()='rect']"; List<WebElement> pendingBars = driver.findElement(By.xpath(pendingBarsLocator)); for (int i = 1; i <= pendingBars.size(); i++) { String targetBarLocator = pendingBarsLocator + "[" + i + "]"; targetBar = driver.findElement(By.xpath(targetBarLocator)); targetBarLabel = getBarLabelFromTooltip(targetBar); targetBarStatus = getBarStatusFromTooltip(targetBar); //遍历所有相同颜色属性的柱条,根据提示文本中的标签唯一确定目标柱条 if (barLabel.equalsIgnoreCase(targetBarLabel) & barStatus.equalsIgnoreCase(targetBarStatus)) { return targetBar; } } } else if (barColor.equalsIgnoreCase(approvedColor)) { String approvedBarsLocator = "//div[@id='emx_eChart_eChart_1']/div [@class='emxChartWrapper']/*[name()='svg']/*[name()='g'] [1]/*[name()='g']/*[name()='g'][2]/*[name()='rect']"; List<WebElement> approvedBars = driver.findElement(By.xpath(approvedBarsLocator)); for (int i = 1; i <= approvedBars.size(); i++) { String targetBarLocator = approvedBarsLocator + "[" + i + "]"; targetBar = driver.findElement(By.xpath(targetBarLocator)); targetBarLabel = getBarLabelFromTooltip(targetBar); targetBarStatus = getBarStatusFromTooltip(targetBar); //遍历所有相同颜色属性的柱条,根据提示文本中的标签唯一确定目标柱条 if (barLabel.equalsIgnoreCase(targetBarLabel) & barStatus.equalsIgnoreCase(targetBarStatus)) { return targetBar; } } } else if (barColor.equalsIgnoreCase(previousColor)) { String previousBarsLocator = "//div[@id='emx_eChart_eChart_1']/div [@class='emxChartWrapper']/*[name()='svg']/*[name()='g'] [2]/*[name()='g']/*[name()='g']/*[name()='rect']"; List<WebElement> previousBars = driver.findElement(By.xpath(previousBarsLocator)); for (int i = 1; i <= previousBars.size(); i++) { String targetBarLocator = previousBarsLocator + "[" + i + "]"; targetBar = driver.findElement(By.xpath(targetBarLocator)); targetBarLabel = getBarLabelFromTooltip(targetBar); targetBarStatus = getBarStatusFromTooltip(targetBar); //遍历所有相同颜色属性的柱条,根据提示文本中的标签唯一确定目标柱条 if (barLabel.equalsIgnoreCase(targetBarLabel)) { return targetBar; } } } return targetBar; } //已知柱条颜色得出柱条的状态属性 public String getBarStatus(String barColor) { String barStatus = null; if (barColor.equalsIgnoreCase(previousColor)) { barStatus = "Previous"; } else if (barColor.equalsIgnoreCase(pendingColor)) { barStatus = "Pending Approval"; } else if (barColor.equalsIgnoreCase(approvedColor)) { barStatus = "Approved"; } return barStatus; } //将鼠标悬停在柱条上,获取提示信息文本 public String[] getBarTooltipText(WebElement targetBar) { String[] array = null; String barColor = targetBar.getAttribute("fill"); if (barColor.equalsIgnoreCase(approvedColor) || barColor.equalsIgnoreCase(approvedHighlightColor)) { array = getTooltipText(targetBar); //对于同一水平线上的后半部分柱条,需要将鼠标移动到某个特定的坐标上做悬停操作 } else if (barColor.equalsIgnoreCase(pendingColor) || barColor.equalsIgnoreCase(pendingHighlightColor)) { int xOffset = Double.valueOf(targetBar.getAttribute("width")).intValue(); int yOffset = Double.valueOf(targetBar.getAttribute("height")).intValue(); array = getTooltipText(targetBar, xOffset, yOffset); } return array; } //截取提示信息文本中的标签名字部分 public String getBarLabelFromTooltip(WebElement targetBar) { String[] tooltip = getBarTooltipText(targetBar); String label = null; if (tooltip.length == 3) { label = tooltip[0].trim(); //提示信息中第一个 String 是标签名字 } return label; } //截图提示信息文本中的状态属性 public String getBarStatusFromTooltip(WebElement targetBar) { String[] tooltip = getBarTooltipText(targetBar); String label = null; if (tooltip.length == 3) { int index = tooltip[1].indexOf(":"); label = tooltip[1].substring(0, index); //提示信息中第二个 String 是状态属性 } return label; } }结束语
当我们能够精确定位到 Dojo Chart 的每个元素之后,操作这些元素和操作普通元素是一样,我们可以对它做单击,双击,拖拽以及其他日常的操作,随着 Dojo Chart 应用的日益广泛,Dojo Chart 的自动化测试也将越来越规范,让我们继续做更深一步的探索和发现。


![[HBLOG]公众号](https://www.liuhaihua.cn/img/qrcode_gzh.jpg)

