Graphite监控新手入门
在本文中,我将提供一个帮助读者了解用Graphite套件创建监控系统所涉及的全部工作的指南。
主要讨论内容
在本文中我们将会谈及如下用于创建Graphite监控系统的主题:
- Carbon和Whisper简介
- Whisper存储模式和聚合
- Graphite Web应用
前提条件
首先,我们需要能够运行Graphite套件的硬件资源。为了简单起见,我将使用 Amazon Web Services EC2 主机。不过,你也可以使用办公室或家中已有的任何型号的计算机。
技术规格:
- 操作系统:Red Hat Enterprise Linux (RHEL) 6.5
- 实例类型:m3.xlarge
- 弹性存储区块(EBS)容量:250 GB
- Python版本:2.6.6
Carbon和Whisper简介
Graphite由多个后端和前端组件组成。后端组件用于存储数值型的时间序列数据。前端组件则用于获取指标项数据并根据情况渲染图表。在本文中,我首先会介绍后端组件: Carbon 和Whisper 。
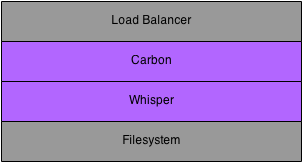
指标项可以被发布到一个负载均衡器或直接发布到一个Carbon 线程中。Carbon 线程与Whisper 数据库交互,将时间序列数据存储到文件系统中。
安装Carbon
Carbon 实际上是一系列守护进程,组成一个Graphite安装的存储后端。这些守护进程用一个名为 Twisted 的事件驱动网络引擎监听时间序列数据。Twisted框架让 Carbon 守护进程能够以很低的开销处理大量的客户端和流量。
要安装Carbon,运行如下命令即可(假设目标系统是RHEL操作系统):
# sudo yum groupinstall "Development Tools" # sudo yum install python-devel # sudo yum install git # sudo easy_install pip # sudo pip install twisted # cd /tmp # git clone https://github.com/graphite-project/carbon.git # cd /tmp/carbon # sudo python setup.py install
/opt/graphite文件夹下将包含如下Carbon库和配置文件:
# ls -l /opt/graphite drwxr-xr-x. 2 root root 4096 May 18 23:56 bin drwxr-xr-x. 2 root root 4096 May 18 23:56 conf drwxr-xr-x. 4 root root 4096 May 18 23:56 lib drwxr-xr-x. 6 root root 4096 May 18 23:56 storage
在 bin 文件夹下,能够找到如下三种不同类型的 Carbon 守护进程:
- Cache :接受通过各种协议传输来的指标项数据并以尽可能高的效率将它们写入磁盘;在接收到指标项时,将指标项值缓存在RAM中,并用底层的Whisper库按照指定的时间间隔将这些值写入磁盘。
- Relay :有两个不同的用途:将输入的指标项复制并分区。
- Aggregator : 运行于cache前方,在Whisper中记录指标项之前,缓存这些指标项一段时间。
安装Whisper
Whisper 是一个用于存储时间序列数据的数据库,之后应用程序可以用 create ,update 和fetch 操作获取并操作这些数据。
安装Whisper,需要运行如下命令:
# cd /tmp # git clone https://github.com/graphite-project/whisper.git # cd /tmp/whisper # sudo python setup.py install
Whisper脚本现在应该已经相应的位置:
# ls -l /usr/bin/whisper* -rwxr-xr-x. 1 root root 1711 May 19 00:00 /usr/bin/whisper-create.py -rwxr-xr-x. 1 root root 2902 May 19 00:00 /usr/bin/whisper-dump.py -rwxr-xr-x. 1 root root 1779 May 19 00:00 /usr/bin/whisper-fetch.py -rwxr-xr-x. 1 root root 1121 May 19 00:00 /usr/bin/whisper-info.py -rwxr-xr-x. 1 root root 674 May 19 00:00 /usr/bin/whisper-merge.py -rwxr-xr-x. 1 root root 5982 May 19 00:00 /usr/bin/whisper-resize.py -rwxr-xr-x. 1 root root 1060 May 19 00:00 /usr/bin/whisper-set-aggregation-method.py -rwxr-xr-x. 1 root root 969 May 19 00:00 /usr/bin/whisper-update.py
启动Carbon缓存进程
Carbon安装包中包含了关于端口号和其他多个配置参数的明确缺省值。拷贝这些已有的示例配置文件:
# cd /opt/graphite/conf # cp aggregation-rules.conf.example aggregation-rules.conf # cp blacklist.conf.example blacklist.conf # cp carbon.conf.example carbon.conf # cp carbon.amqp.conf.example carbon.amqp.conf # cp relay-rules.conf.example relay-rules.conf # cp rewrite-rules.conf.example rewrite-rules.conf # cp storage-schemas.conf.example storage-schemas.conf # cp storage-aggregation.conf.example storage-aggregation.conf # cp whitelist.conf.example whitelist.conf # vi carbon.conf
在 cache 区段下,接收端口这一行包含一个默认值,用于通过 平文本协议( plaintext protocol ) 接受输入指标项(如下所示):
[cache] LINE_RECEIVER_INTERFACE = 0.0.0.0 LINE_RECEIVER_PORT = 2003
执行如下命令,可以启动一个carbon-cache进程:
# cd /opt/graphite/bin # ./carbon-cache.py start Starting carbon-cache (instance a)
这个进程现在应该正在监听2003端口:
# ps -efla | grep carbon-cache 1 S root 2674 1 0 80 0 - 75916 ep_pol 00:18 ? 00:00:03 /usr/bin/python ./carbon-cache.py start # netstat -nap | grep 2003 tcp 0 0 0.0.0.0:2003 0.0.0.0:* LISTEN 2674/python
发布指标项
指标项(metric ) 是一种随着时间不断变化的可度量的数量,例如:
- 每秒请求数
- 请求处理时间
- CPU使用情况
A datapoint is a tuple containing:
数据点(datapoint ) 是包含如下信息的三元组:
- 指标项名称
- 度量值
- 时间序列上某个特定的点(通常是一个时间戳)
客户端应用程序通过将数据点发送至Carbon进程发布指标项。应用程序在Carbon进程所监听的端口上建立TCP连接,然后以简单平文本格式发送数据点信息。在本文的示例中,这个端口号是2003。这个TCP连接可能会一直处于打开状态并根据需要尽可能多次重复使用。Carbon进程监听输入的数据但是并不会给客户端返回任何响应。
数据点的格式 定义如下:
- 每个数据点是一行文本
- 位置0是带点的指标项名称
- 位置1是一个值
- 位置2是一个Unix时间戳
- 空格作为各个位置之间的分隔符
例如,下面是一些有效的数据点:
- carbon-cache进程每分钟接收到的指标项数量
- carbon.agents.graphite-tutorial.metricsReceived 28198 1400509108
- carbon-cache每分钟创建的指标项数量
- carbon.agents.graphite-tutorial.creates 8 1400509110
- 示例服务器端点每分钟的p95响应次数
- PRODUCTION.host.graphite-tutorial.responseTime.p95 0.10 1400509112
客户端应用程序发布指标项的方式可以有多种:
- 通过像 netcat (nc)命令这样的工具,使用 平文本协议 发布
- 使用 pickle协议
- 使用 高级消息队列协议(AMQP)
- 用 函数库 ,如 Dropwizard Metrics库
为了简单起见,在本文示例中我将通过netcat命令用平文本协议发布指标项。发布如上所列的示例数据点,运行如下命令即可:
sudo yum install nc echo "carbon.agents.graphite-tutorial.metricsReceived 28198 `date +%s`" | nc localhost 2003 echo "carbon.agents.graphite-tutorial.creates 8 `date +%s`" | nc localhost 2003 echo "PRODUCTION.host.graphite-tutorial.responseTime.p95 0.10 `date +%s`" | nc localhost 2003
carbon-cache的日志文件中将包含接收到的新指标项的有关信息以及存储这些信息的位置:
# tail -f /opt/graphite/storage/log/carbon-cache/carbon-cache-a/creates.log 19/05/2014 10:42:44 :: creating database file /opt/graphite/storage/whisper/carbon/agents/graphite-tutorial/metricsReceived.wsp (archive=[(60, 129600)] xff=0.5 agg=average) 19/05/2014 10:42:53 :: creating database file /opt/graphite/storage/whisper/carbon/agents/graphite-tutorial/creates.wsp (archive=[(60, 129600)] xff=0.5 agg=average) 19/05/2014 10:42:57 :: creating database file /opt/graphite/storage/whisper/PRODUCTION/host/graphite-tutorial/responseTime/p95.wsp (archive=[(60, 1440)] xff=0.5 agg=average)
Carbon与Whisper交互,将这些时间序列数据存储到文件系统中。切换到文件系统相应的位置,确保数据文件已经创建成功:
# ls -l /opt/graphite/storage/whisper/carbon/agents/graphite-tutorial/ total 3040 -rw-r--r--. 1 root root 1555228 May 19 10:42 creates.wsp -rw-r--r--. 1 root root 1555228 May 19 10:42 metricsReceived.wsp # ls -l /opt/graphite/storage/whisper/PRODUCTION/host/graphite-tutorial/responseTime/ total 20 -rw-r--r--. 1 root root 17308 May 19 10:42 p95.wsp
最后,你可以用 whisper-info 脚本获取为这些指标项创建的Whisper文件的元数据信息。
# whisper-info.py /opt/graphite/storage/whisper/PRODUCTION/host/graphite-tutorial/responseTime/p95.wsp maxRetention: 86400 xFilesFactor: 0.5 aggregationMethod: average fileSize: 17308 Archive 0 retention: 86400 secondsPerPoint: 60 points: 1440 size: 17280 offset: 28
whisper-dump 是一个更完整的脚本,可以输出所有存储保留周期内的原始数据以及Whisper文件的元数据信息。
# whisper-dump.py /opt/graphite/storage/whisper/PRODUCTION/host/graphite-tutorial/responseTime/p95.wsp Meta data: aggregation method: average max retention: 86400 xFilesFactor: 0.5 Archive 0 info: offset: 28 seconds per point: 60 points: 1440 retention: 86400 size: 17280 Archive 0 data: 0: 1400609220, 0.1000000000000000055511151231257827 1: 0, 0 2: 0, 0 3: 0, 0 4: 0, 0 5: 0, 0 ... 1437: 0, 0 1438: 0, 0 1439: 0, 0
理解聚合方法,最大保留期,xFilesFactor和Whisper文件中的其他属性是相当重要的。如果现在你有一点迷茫,也不要过于担心,我将在接下来的章节中详细讨论这些属性。
Whisper存储模式和聚合
当你或你的开发者同事和系统管理员们开始发布数据点却得到了一些意想不到的结果时,可能会有一些困惑:
- 为什么我的数据点被平均了?
- 我已经在周期性地发布数据点了,为什么还是没有任何数据点?
- 我已经发布很多天数据点了,为什么我只得到一天的数据?
Whisper是如何存储数据的?
首先我们需要理解数据是如何在Whisper文件中存储的。当Whisper文件被创建时,将拥有一个固定的文件尺寸,这个尺寸永远不会再改变。在Whisper文件中可能会包含多个用于不同分辨率的数据点的“ 存储区( bucket ) ”,这些存储区是在配置文件中定义的。
例如:
- 存储器A:拥有10秒分辨率的数据点
- 存储区B:拥有60秒分辨率的数据点
- 存储区C:拥有10分钟分辨率的数据点
每个存储区还拥有一个保留期(retention)属性用于标识该存储区中的数据点应该保留的时间长度。例如:
- 存储区A:分辨率为10秒,保留时间6小时的数据点
- 存储区B:分辨率为60秒,保留时间1天的数据点
- 存储区C:分辨率为10分钟,保留时间7天的数据点
根据上述两种信息,Whisper可以进行一些简单的数学计算,计算出在每个存储区中实际需要保存多少数据点。
- 存储区A:6小时 x 60分钟/小时 x 6数据点/分钟 = 2160点
- 存储区B:1天 x 24小时/天 x 60分钟/小时 x 1数据点/分钟 = 1440点
- 存储区C:7天 x 24小时/天 x 6数据点/小时 = 1008点
如果根据这个存储模式配置创建Whisper文件,该文件大小是56KB。如果在这个文件上执行 whisper-dump.py 脚本,会有如下输出。需要注意的是,一个 archive 对应一个 存储区 , 每点秒数( seconds per point ) 和 点数( points ) 属性则与我们之前的计算相匹配。
元数据:
aggregation method: average max retention: 604800 xFilesFactor: 0.5 Archive 0 info: offset: 52 seconds per point: 10 points: 2160 retention: 21600 size: 25920 Archive 1 info: offset: 25972 seconds per point: 60 points: 1440 retention: 86400 size: 17280 Archive 2 info: offset: 43252 seconds per point: 600 points: 1008 retention: 604800 size: 12096
关于聚合
当数据从一个较高精度的存储区移动到一个较低精度的存储区时,聚合开始发挥作用。让我们以前一个示例中的存储区A和存储区B为例:
- 存储区A:分辨率为10秒,保留时间6小时的数据点(较高精度)
- 存储区B:分辨率为60秒,保留时间1天的数据点(较低精度)
我们可能有一个每10秒钟发布一个数据点的应用程序。在存储区A中可以找到6小时之内发布的任何数据点。不过,如果我开始查询6小时之前发布的数据点,就可以在存储区B中找到它们。
数据点如何移动到存储区B?
用高精度值除以低精度值,以确定需要聚合的数据点的数量。
l 60秒(存储区B)/10秒(存储区A)= 6个数据点需要聚合
注: Whisper需要较高精度的值能够整除较低精度的值(也就是说,相除的结果必须是整数)。否则聚合的结果可能会不准确。
聚合数据时,Whisper从存储区A中读取6个10秒数据点,然后将函数应用于这些数据点上,得出一个将被存储在存储区B中的60秒数据点。有5个聚合函数选项: average ,sum ,max ,min 和last 。 聚合函数的选择取决于需要处理的数据点。例如,第95百分位的值可能应该用 max 函数聚合。另一方面,对于计数器来说, sum 函数可能更合适。
在聚合数据点时,Whisper还处理了xFilesFactor的概念。xFilesFactor表示为了保证聚合准确,一个存储区必须包含的数据点比率。在我们之前的示例中,Whisper确定了它需要聚合6个10秒数据点。由于网络问题,应用重启等原因,可能只有4个数据点有数据而其他2个数据点是空值。
如果我们的Whisper文件的xFilesFactor是0.5,这意味着只有存在至少50%的数据点时,Whisper才会聚合数据。如果超过50%的数据点为空时,Whisper会创建一个空值聚合。在我们的例子中,即6个数据点中的4个——也就是66%。聚合函数会被应用在非空数据点上,创建聚合值。
你可以将xFilesFactor设置为0到1之间的任意值。值0表示即使只有一个有效数据点,就会执行聚合。值1则表示只有全部的数据点都有效,才会执行聚合。
在前一章节中,我们将所有的样例配置文件拷贝到了 /opt/graphite/conf 文件夹中。控制Whisper文件如何创建的配置文件如下:
- /opt/graphite/conf/storage-schemas.conf
- /opt/graphite/conf/storage-aggregation.conf
默认存储模式
存储模式(storage-schemas ) 配置文件由多个条目组成,每个条目中包含一个模式,用于匹配指标项名称和保留期定义。默认情况下,包含两个条目:Carbon和 全部其他 。
carbon 条目匹配以“carbon”字符串开头的指标项名称。默认情况下,Carbon守护进程每60秒发布一次它们自己内部的指标项(这一间隔是可以更改的)。例如,carbon-cache进程会发布指标项,用于标识该进程每分钟创建的指标项文件的数量。保留期的定义则表示数据点每60秒记录一次,并保存90天。
[carbon] pattern = ^carbon/. retentions = 60s:90d
全部其他 条目通过指定带星号的模式捕捉全部其他与 Carbon 无关的指标项。这个保留期的定义表示数据点每60秒记录一次,并保存1天。
[default_1min_for_1day] pattern = .* retentions = 60s:1d
默认存储聚合
storage-aggregation 配置文件也是由多个条目组成,其中包括:
- 匹配指标项名称的模式
- 一个xFilesFactor值
- 一个聚合函数
默认情况下,包含4个条目:
- 以.min结尾的指标项
- 使用min聚合函数
- 至少有10%数据点才可以聚合
- 以.max结尾的指标项
- 使用max聚合函数
- 至少有10%数据点才可以聚合
- 以.max结尾的指标项
- 使用sum聚合函数
- 聚合的前提是至少要有一个数据点
- 其他指标项
- 使用average聚合函数
- 至少有10%数据点才可以聚合
[min] pattern = /.min$ xFilesFactor = 0.1 aggregationMethod = min [max] pattern = /.max$ xFilesFactor = 0.1 aggregationMethod = max [sum] pattern = /.count$ xFilesFactor = 0 aggregationMethod = sum [default_average] pattern = .* xFilesFactor = 0.5 aggregationMethod = average
在测试环境下,默认的存储模式和存储聚合函数可以很好的完成任务,不过真正应用到生产指标项时,可能还要修改配置文件。
存储模式修改
首先,我会修改Carbon条目。我希望Carbon每60秒记录一次指标项,并将这些指标项保存180天(6个月)。180天之后,我希望能够以10分钟的精度将这些指标项归档,再保存180天。
[carbon] pattern = ^carbon/. retentions = 1min:180d,10min:180d
在Squarespace,我们用 Dropwizard 框架构建RESTful的Web Service。在准生产环境和生产环境中,我们运行了许多这样的服务,所有这些服务都使用 Dropwizard Metrics 库以每10秒一次的速度发布应用和业务指标项。这种10秒一次的数据我会保存3天。3天后,这些数据将被聚合为1分钟数据并保存180天(6个月)。最后,6个月之后,这些数据将被聚合为10分钟数据并再保存180天。
注: 如果我的指标项库以不同的速度发布数据点,我就需要修改保留的定义以匹配新的速度。
[production_staging] pattern = ^(PRODUCTION|STAGING).* retentions = 10s:3d,1min:180d,10min:180d
而Carbon,生产环境或准生产环境之外的指标项,可能只是用于测试。我会将这些数据保存1天并且假设他们会每1分钟发布一次。
[default_1min_for_1day] pattern = .* retentions = 60s:1d
修改存储聚合
我会保留默认的存储聚合条目,不过会增加几条新的条目用于以ratio,m1_rate和p95结尾的指标项。
注: 新增的条目需要添加到 default 条目之前。
[ratio] pattern = /.ratio$ xFilesFactor = 0.1 aggregationMethod = average [m1_rate] pattern = /.m1_rate$ xFilesFactor = 0.1 aggregationMethod = sum [p95] pattern = /.p95$ xFilesFactor = 0.1 aggregationMethod = max
目前为止,你已经完成了Graphite后端的配置以匹配应用程序发布数据点的速率并且已经完全理解数据点是如何在文件系统中存储的。接下来的一章,我们将尝试用graphite-webapp将这些数据可视化。
Graphite Web应用
现在,后端组件已经成功启动并运行,并且能够用我们指定的格式存储数值型的时间序列数据,接下来我们将了解Graphite的前端组件。具体说来,我们需要查询并可视化已存储的信息的途径。
据其 Github描述文件 所介绍,Graphite Web应用程序是一个运行在Apache/mod_wsgi下的Django应用程序。一般来说,能够提供如下功能:
- 一个用于获取原始数据并生成图表的基于URL的 API端点
- 一个用于导航指标项以及构建并保存仪表盘的 用户界面 。
安装迷阵
graphite-web的安装真的可以称得上是一个迷阵。我已经多次尝试安装graphite-web——在RHEL,CentOS,Ubuntu和Mac OS X上——而每一次的安装步骤都是有不同的。你可以把它当成一场游戏,享受这个过程,当所有必需的依赖都成功安装完成后,你就知道你已经完成了这个迷阵。
RHEL 6.5安装指南:
# cd /tmp # git clone https://github.com/graphite-project/graphite-web.git # cd /tmp/graphite-web # python check-dependencies.py [REQUIRED] Unable to import the 'django' module, do you have Django installed for python 2.6.6? [REQUIRED] Unable to import the 'pyparsing' module, do you have pyparsing module installed for python 2.6.6? [REQUIRED] Unable to import the 'tagging' module, do you have django-tagging installed for python 2.6.6? [OPTIONAL] Unable to import the 'memcache' module, do you have python-memcached installed for python 2.6.6? This feature is not required but greatly improves performance. [OPTIONAL] Unable to import the 'txamqp' module, this is required if you want to use AMQP as an input to Carbon. Note that txamqp requires python 2.5 or greater. [OPTIONAL] Unable to import the 'python-rrdtool' module, this is required for reading RRD. 3 optional dependencies not met. Please consider the optional items before proceeding. 3 necessary dependencies not met. Graphite will not function until these dependencies are fulfilled.
目标是保证至少所有必需的依赖都安装成功。如果计划使用AMQ功能或Memcache的缓存功能,就还需要安装可选依赖。
# sudo yum install cairo-devel # sudo yum install pycairo-devel # sudo pip install django # sudo pip install pyparsing # sudo pip install django-tagging # sudo pip install python-memcached # sudo pip install txamqp # sudo pip install pytz # cd /tmp/graphite-web # python check-dependencies.py [OPTIONAL] Unable to import the 'python-rrdtool' module, this is required for reading RRD. 1 optional dependencies not met. Please consider the optional items before proceeding. All necessary dependencies are met.
我已经安装了很多包,满足 必需 依赖的要求后,就可以开始安装graphite-web:
# cd /tmp/graphite-web # sudo python setup.py install # ls -l /opt/graphite/webapp/ total 12 drwxr-xr-x. 6 root root 4096 May 23 14:33 content drwxr-xr-x. 15 root root 4096 May 23 14:33 graphite -rw-r--r--. 1 root root 280 May 23 14:33 graphite_web-0.10.0_alpha-py2.6.egg-info
安装脚本会将web应用文件移动到 /opt/graphite/webapp 文件夹下适当的位置。
数据库初始化
web应用程序维护了一个内部数据库用于保存用户信息和仪表盘。运行如下命令初始化该数据库:
# cd /opt/graphite # export PYTHONPATH=$PYTHONPATH:`pwd`/webapp # django-admin.py syncdb --settings=graphite.settings You just installed Django's auth system, which means you don't have any superusers defined. Would you like to create one now? (yes/no): yes Username (leave blank to use 'root'): feangulo Email address: feangulo@yaipan.com Password: Password (again): Error: Blank passwords aren't allowed. Password: Password (again): Superuser created successfully. Installing custom SQL ... Installing indexes ... Installed 0 object(s) from 0 fixture(s)
上述命令将创建一个新的数据库并将其保存在 /opt/graphite/storage 文件夹下:
# ls -l /opt/graphite/storage/graphite.db -rw-r--r--. 1 root root 74752 May 23 14:46 /opt/graphite/storage/graphite.db
Graphite Web应用设置
包含graphite-webapp设置的配置文件位于 /opt/graphite/webapp/graphit 文件夹下。将样例配置文件拷贝到该文件夹下:
# vi /opt/graphite/webapp/graphite/local_settings.py ######################### # General Configuration # ######################### TIME_ZONE = 'UTC' ########################## # Database Configuration # ########################## DATABASES = { 'default': { 'NAME': '/opt/graphite/storage/graphite.db', 'ENGINE': 'django.db.backends.sqlite3', 'USER': '', 'PASSWORD': '', 'HOST': '', 'PORT': '' } } 到现在为止,如果你遵循前述章节的指令,现在只会有一个运行在2003端口上的carbon-cache进程和一个7002查询端口。这些是默认情况下graphite-webapp所需的端口。因此,配置文件无需任何修改。
# ps -efla | grep carbon-cache 1 S root 14101 1 0 80 0 - 75955 ep_pol May20 ? 00:00:26 /usr/bin/python ./carbon-cache.py start # netstat -nap | grep 2003 tcp 0 0 0.0.0.0:2003 0.0.0.0:* LISTEN 14101/python # netstat -nap | grep 7002 tcp 0 0 0.0.0.0:7002 0.0.0.0:* LISTEN 14101/python
不过,你也可以在设置文件中显式指定从哪个carbon-cache进程读取数据:
# vi /opt/graphite/webapp/graphite/local_settings.py ######################### # Cluster Configuration # ######################### CARBONLINK_HOSTS = ["127.0.0.1:7002:a"]
上述代码的含义是我有一个本地运行的名为‘a’的carbon-cache进程,其查询端口设置为7002。查看Carbon配置文件,将会看到如下配置:
# vi /opt/graphite/conf/carbon.conf [cache] LINE_RECEIVER_INTERFACE = 0.0.0.0 LINE_RECEIVER_PORT = 2003 CACHE_QUERY_INTERFACE = 0.0.0.0 CACHE_QUERY_PORT = 7002
注: ‘a’ 是从何而来的呢?是默认分配的名字。如果要定义更多缓存,需要在配置文件中创建新的命名区块。
[cache:b] LINE_RECEIVER_INTERFACE = 0.0.0.0 LINE_RECEIVER_PORT = 2004 CACHE_QUERY_INTERFACE = 0.0.0.0 CACHE_QUERY_PORT = 7003
仪表盘和图表模版配置
Graphite Web应用中包含默认的仪表盘和图表模版。拷贝样例配置文件:
# cd /opt/graphite/conf # cp dashboard.conf.example dashboard.conf # cp graphTemplates.conf.example graphTemplates.conf
我对仪表盘配置文件作了一些修改,让图表展示区块更大。
# vi /opt/graphite/conf/dashboard.conf [ui] default_graph_width = 500 default_graph_height = 400 automatic_variants = true refresh_interval = 60 autocomplete_delay = 375 merge_hover_delay = 750
我对默认的图表模版也做了一些修改,让它有一个黑色背景和白色前景。另外我还把字体调小了一些。
# vi /opt/graphite/conf/graphTemplates.conf [default] background = black foreground = white minorLine = grey majorLine = rose lineColors = blue,green,red,purple,brown,yellow,aqua,grey,magenta,pink,gold,rose fontName = Sans fontSize = 9 fontBold = False fontItalic = False
运行Web应用程序
终于,一切准备就绪,可以运行Web应用程序了。我会在8085端口运行这个Web应用,你可以随意设置这个端口号。运行如下命令:
# cd /opt/graphite # PYTHONPATH=`pwd`/storage/whisper ./bin/run-graphite-devel-server.py --port=8085 --libs=`pwd`/webapp /opt/graphite 1>/opt/graphite/storage/log/webapp/process.log 2>&1 & # tail -f /opt/graphite/storage/log/webapp/process.log
打开一个Web浏览器并输入如下地址http://your-ip:8085。确保Graphite Web应用能够正常加载。用tail命令查看 process.log 文件的输出,应该可以看到资源的加载和来自于web应用的查询。
(点击图片查看大图)
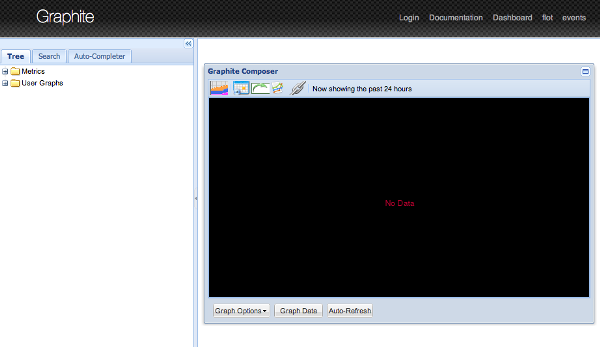
指标项导航
在上一章中,我们用netcat命令将几个指标项发布到carbon-cache进程中。具体如下:
carbon.agents.graphite-tutorial.metricsReceived carbon.agents.graphite-tutorial.creates PRODUCTION.host.graphite-tutorial.responseTime.p95
Web应用程序以树状结构展示这些指标项。如果在左侧面板中操作指标树,就可以看到全部的指标项。
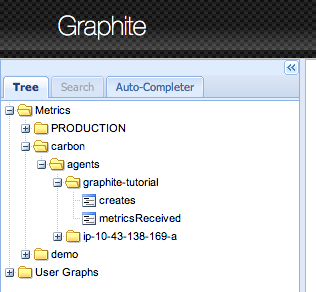
点击任意一个指标项,右边的面板上将绘制出这个指标项的图表(默认情况下是过去24小时的数据)。可以通过面板中图表上方的按钮修改查询的日期范围。
(点击图片查看大图)

创建仪表盘
默认的视图适于快速浏览指标项并将其可视化。不过如果想构建一个仪表盘,可以将浏览器地址指向http://your-ip:8085/dashboard。该页面的顶栏是另外一种方式的指标项导航。可以用点击选项的方式导航,也可以直接输入文本获取建议。点击某个指标项在底部区域将出现相应的图表区块。继续点击新的指标项,下方的面板中将会显示新增的图块,从而创建一个仪表盘。有时你可能想要在一个图表中展示多个指标项。要实现这个功能,将一个图块拖拽到另一个图块上方,多个指标项就会绘制在同一张图表上。通过图块的拖拽,也可以改变其在布局中的位置。
(点击图片查看大图)
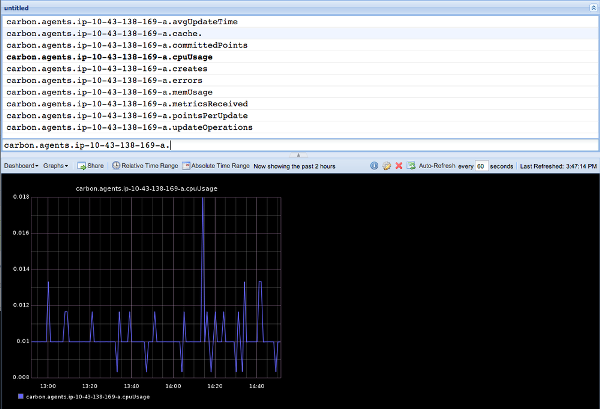
用户界面看起来十分简单,不过不要感到灰心。你仍然可以在指标项数据上完成强大的操作。点击某个图表区块,会弹出一个对话框。对话框中展示了正在绘制的指标项列表,你可以直接编辑这些指标项。对话框中还有多个菜单,用于在数据上应用函数,修改可视化界面的外观以及其他许多操作。
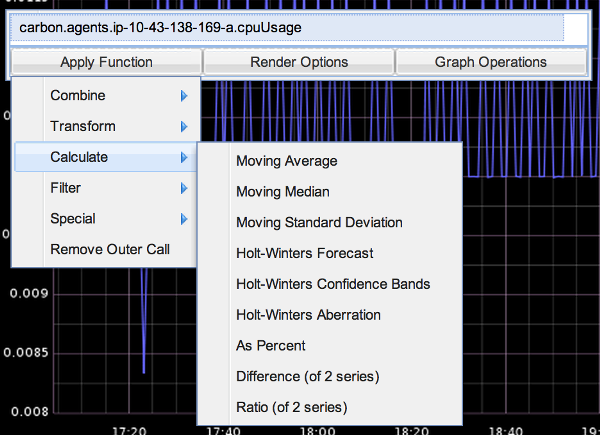
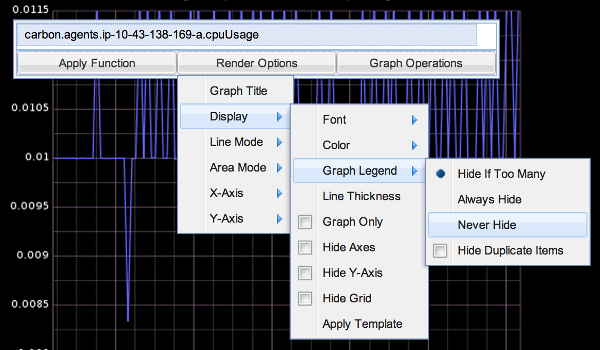
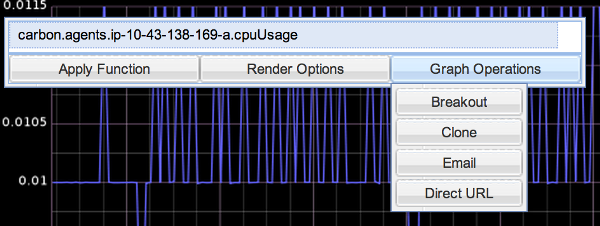
此外,还可以用最顶端的菜单保存仪表盘,加载其他仪表盘,修改当前仪表盘的日期范围,分享仪表盘以及其他一些功能。目前为止我最喜欢的功能是 Dashboard -> Edit Dashboard 。当我需要创建或修改仪表盘时,这个功能节省了我许多时间。
(点击图片查看大图)

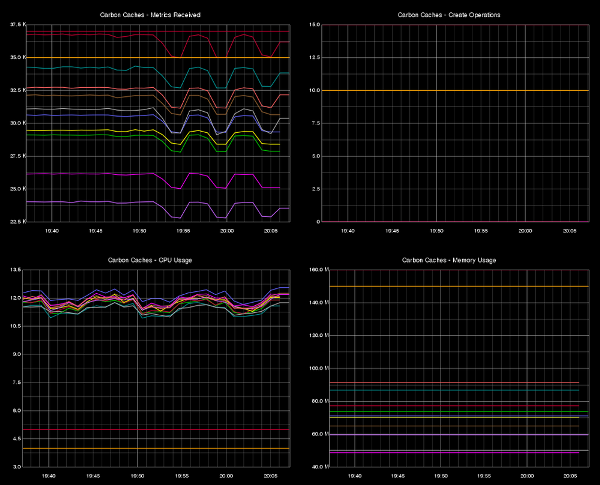
为了举例说明这一功能,我将构建一个用于监控carbon-cache进程的仪表盘。前一章中曾经提到过, Carbon 进程会记录内部指标项。相比于手工构建仪表盘,我更喜欢用 Edit Dashboard 这一功能。
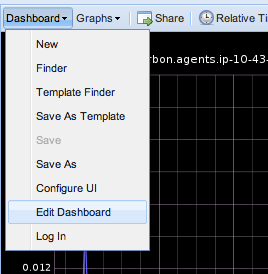

在 Edit Dashboard 窗口中输入如下代码,即可构建用于监控carbon-cache进程的仪表盘。
注:该仪表盘会监控所有正在运行的carbon-cache进程。注意在指标项名称中星号(*)的使用会匹配所有以 carbon.agents 为前缀的值。
[ { "target": [ "aliasByNode(carbon.agents.*.metricsReceived,2)" ], "title": "Carbon Caches - Metrics Received" }, { "target": [ "aliasByNode(carbon.agents.*.creates,2)" ], "title": "Carbon Caches - Create Operations" }, { "target": [ "aliasByNode(carbon.agents.*.cpuUsage,2)" ], "title": "Carbon Caches - CPU Usage" }, { "target": [ "aliasByNode(carbon.agents.*.memUsage,2)" ], "title": "Carbon Caches - Memory Usage" } ] 更新仪表盘的定义会看到如下界面:
(点击图片查看大图)
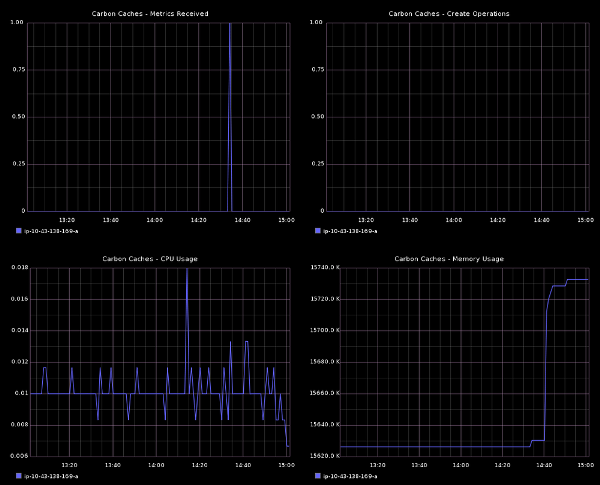
修改 Edit Dashboard 对话框中的内容会更新浏览器中的仪表盘。不过这些修改并没有保存到Graphite的内部仪表盘数据库中。继续并保存该仪表盘,以便可以分享并再次打开它。
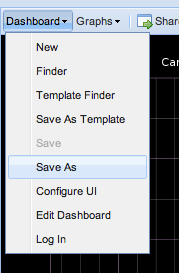
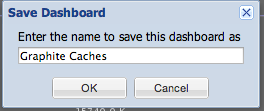
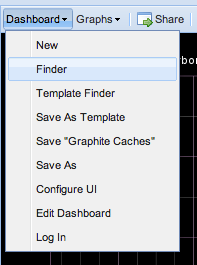
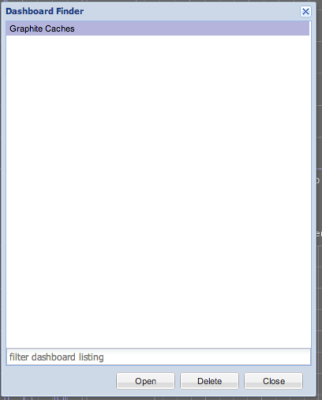
如果要查找仪表盘,打开 发现器( Finder ) :
在Graphite的生产安装环境中, Graphite Caches 仪表盘的外观界面更类似下图:
API才是重点
与其他工具一样,Graphite也有一些缺点:例如扩展性不是很好,存储机制并非最优——但是Graphite的API是相当漂亮的。有用户界面的感觉很不错,不过最重要的是通过UI可以完成的工作,完全都可以通过graphite-web API请求来完成。用户可以通过构造一个简单的URL来请求定制化图表。在HTTP GET请求的查询串中指定参数。默认情况下,请求响应会返回一个PNG图片,不过用户也可以指明所需返回的格式——如,JSON数据。
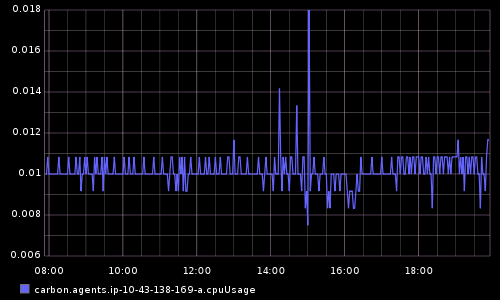
样例请求#1:
- 指标项: 所有carbon-cache进程的CPU使用情况
- 图表尺寸: 500x300
- 时间范围: 12小时前到5分钟前
- 返回格式: PNG图片(默认)
样例请求#2:
- 指标项: 所有carbon-cache进程的CPU使用情况
- 图表尺寸: 500x300
- 时间范围: 12小时前到5分钟前
- 返回格式: JSON数据
http://your-ip:8085/render?target=carbon.agents.*.cpuUsage&width=500&height=300&from=-12h&until=-5min&format=json
(点击图片查看大图)

Graphite API支持多种显示选项以及遵循简单的函数式语法的数据操作函数。考虑到复杂的表达式和计算过程,函数可以嵌套。查看在线文档以详细了解全部可用的函数:
- Graphite 函数: http://graphite.readthedocs.org/en/latest/functions.html
假设我有一个运行在上百台服务器上的应用,每个服务器每10秒钟发布一次各自的p95响应时间。利用API中所提供的函数,我可以对指标项进行加工并构建一个信息化图表:
- averageSeries :计算集合内所有值的平均值
我们想要看一下全部p95时延的平均值
- scale : 将一个值乘以一个常量
时延是以毫秒为单位记录的,我们想要以秒为单位展示。
- alias: 更改指标项展示的名称
我们想要在图表的图例中只展示 avg p95 ,而不是指标项全名
作为指标项查询的一部分传递给API的函数参数如下:
alias(scale(averageSeries(PRODUCTION.host.*.requests.p95),0.001),'avg p95')
API将返回如下图表:

恭喜!我们已经完成了Carbon,Whisper和graphite-webapp的安装和配置,指标项的发布和导航以及仪表盘的构建。现在你可以为你的业务和应用指标项构建漂亮的仪表盘。
本文是关于Graphite的一篇入门级文章。关于更高级的主题请参考:
- Carbon Cache压力测试
- Carbon聚合器
- 基于ELK组件的Graphite查询统计
关于作者

Franklin Angulo 在 Squarespace 的负责管理构建和维护大型核心后端引擎的团队,Squarespace是一家位于纽约市的网站构建平台。Franklin是一名在带领复杂的跨领域的大型工程项目方面有丰富经验的专业人士。在加入Squarespace之前他曾经是亚马逊的一名资深软件开发工程师,主要负责全球进货物流和亚马逊储物柜计划的路由规划调优,运率购买和容量规划算法。
查看英文原文: Getting Started with Monitoring using Graphite
- 本文标签: 数据库 参数 安装 apache 亚马逊 tab json 负载均衡 cat Amazon 数据 服务器 TCP mail grep REST sql update API unix 实例 js 压力 开发 开发者 root 时间 db 软件 find rrdtool Ubuntu RESTful 测试 HTML https 进程 操作系统 UI web 代码 node list tar centos linux 管理 定制 App git 线程 dependencies 配置 rewrite GitHub 端口 消息队列 网站 IDE 协议 CTO ip
- 版权声明: 本文为互联网转载文章,出处已在文章中说明(部分除外)。如果侵权,请联系本站长删除,谢谢。
- 本文海报: 生成海报一 生成海报二


![[HBLOG]公众号](https://www.liuhaihua.cn/img/qrcode_gzh.jpg)

