实例教学:使用 D3.js 实现数据可视化
原文链接: Learn to Create D3.js Data Visualizations by Example
基于 D3.js ,编写 HTML、SVG 和 CSS 就能让你的数据变得生动起来,这是一个基于数据操作 DOM 的 JavaScript 库。
在我看来,每一位 Web 开发者最应该学习的三个 JavaScript 库就是 jQuery、Underscore 和 D3。在学习它们的过程中,你将会从新的角度去思考如何写代码:jQuery 让你知道如何用尽量少的代码,尽可能多地操作 DOM;Underscore (或者称之为 lodash)用函数式的工具改变你写程序的方式;而 D3 给了你大量的操作数据的工具,以及图形化编程的思想。如果你还不了解 D3,请花一些时间看看 它的例子 ,体会一下 D3 能做到什么。
这可不是你老爸的图表库。
D3 有极高的灵活性,它是一个比较基础的可视化 js 库,api 和 jQuery 很像,可以把数据和 HTML 结构或者 SVG 文档对应起来。D3 有丰富的数学函数来处理数据转换和物理计算,它擅长于操作 SVG 中的路径 (path) 和几何图形 (circle, ellipse, rect…)。
这篇文章旨在给读者一个 D3 的概览,在接下来的例子里,你会看到输入的数据、数据变换和最后的输出文档。我将不会解释逐个函数做了什么,我会把代码展示给你看,希望从中你能知道大致这些代码是怎么工作的。只有在 Scales 和 Selections 的部分我才会重点解释。
柱状图
 ( codepen 中查看代码 )
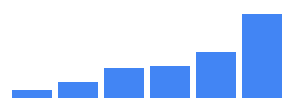
我说过在 D3 中,你能使用到的图表远比 Playfair 先生发明过的要多,但是学跑前先走好路,我们从最简单的柱状图开始,了解一下 D3 是怎么将数据和文档流结合在一起的:
d3.select('#chart')
  .selectAll("div")
  .data([4, 8, 15, 16, 23, 42])
  .enter()
  .append("div")
  .style("height", (d)=> d + "px")
selectAll 方法返回了一个 D3 selection。D3 selection 是一个数组,当针对一个数据点创建一个 div ,然后通过 enter() 和 append() 调用这个 div 时,selection 中的元素就会被创建出来。
上述代码中的输入数据是一组数组:[4, 8, 15, 16, 23, 42],对应的输出 HTML 结构是:
<div id="chart">
  <div style="height: 4px;"></div>
  <div style="height: 8px;"></div>
  <div style="height: 15px;"></div>
  <div style="height: 16px;"></div>
  <div style="height: 23px;"></div>
  <div style="height: 42px;"></div>
</div>
所有不需要通过 JS 控制的视觉层内容都写到 CSS 中:
#chart div {
  display: inline-block;
  background: #4285F4;
  width: 20px;
  margin-right: 3px;
}
GitHub 贡献表
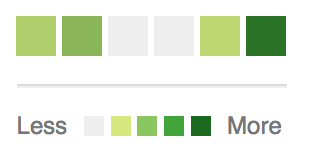
只需要更改柱状图代码中的几行,我们就能得到一个 GitHub 贡献表。
( codepen 中查看代码 )
和柱状图不同地方在于,图表中根据数据变化的不再是元素的高度,而是元素的 background-color (背景色)。
const colorMap = d3.interpolateRgb(
  d3.rgb('#d6e685'),
  d3.rgb('#1e6823')
)

d3.select('#chart')
  .selectAll("div")
  .data([.2, .4, 0, 0, .13, .92])
  .enter()
  .append("div")
  .style("background-color", (d)=> {
    return d == 0 ? '#eee' : colorMap(d)
  })
colorMap 函数接收的输入值要在0到1之间,返回的是一个颜色值,这个值是在以输入值中两两数据为颜色值之间的渐变色值。插值法是图形编程和动画的关键点。在后面我们将会看到更多这方面的例子。
SVG
D3 最大的魅力大概来自于它能应用在 SVG 上,也就是说平面图形比如圆形、多边形、路径和文本,它都可以交互。
<svg width="200" height="200">
  <circle fill="#3E5693" cx="50" cy="120" r="20" />
  <text x="100" y="100">Hello SVG!</text>
  <path d="M100,10L150,70L50,70Z" fill="#BEDBC3" stroke="#539E91" stroke-width="3">
</svg>
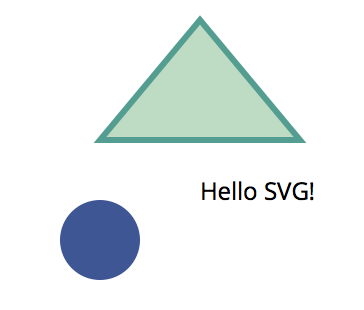
上述代码实现的是:
- 一个圆心在 (50,120),半径是 20 的圆形
- 一段位于 (100,100) 的文本
- 一个 3px 粗边的三角形,
d指的是方向,从点 (100,100) 画线到点 (150,170) 再到点 (50,70) 结束
<path> 可以算是 SVG 中最好用的元素了。
Circles
圆形
( codepen 中查看代码 )
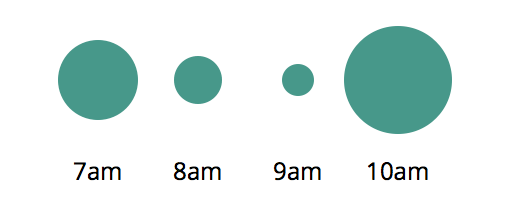
上面的例子中给出的数据结构是很简单的一组数据,D3 的能力远不止于此,它还可以操作更复杂的数据类型。
const data = [{
  label: "7am",
  sales: 20
},{
  label: "8am",
  sales: 12
}, {
  label: "9am",
  sales: 8
}, {
  label: "10am",
  sales: 27
}]
对每一个数据点,我们都将有一个 g (组)元素在 #chart 中,根据对象的属性,每个组里会有一个 <circle> 元素和一个 <text> 元素。
下面的代码将输入数据和 SVG 文档一一对应起来,你能看出它的原理吗?
<svg height="100" width="250" id="chart">
  <g>
    <circle cy="40" cx="50" r="20"/>
    <text y="90" x="50">7am</text>
  </g>
  <g>
    <circle cy="40" cx="100" r="12"/>
    <text y="90" x="100">8am</text>
  </g>
  <g>
    <circle cy="40" cx="150" r="8"/>
    <text y="90" x="150">9am</text>
  </g>
  <g>
    <circle cy="40" cx="200" r="27"/>
    <text y="90" x="200">10am</text>
  </g>
</svg>
折线图
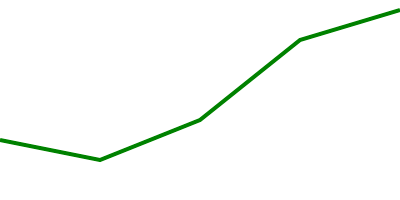
( codepen 中查看代码 )
用 SVG 实现折线图再简单不过,我们将下面这些数据:
const data = [
  { x: 0, y: 30 },
  { x: 50, y: 20 },
  { x: 100, y: 40 },
  { x: 150, y: 80 },
  { x: 200, y: 95 }
]
转换成以下的 SVG 文档:
<svg id="chart" height="100" width="200">
  <path stroke-width="2" d="M0,70L50,80L100,60L150,20L200,5">
</svg>
注意:SVG 代码中的 y 值和输入值的 y 值不同,是用 100 减去给定的 y 值,因为在 SVG 中屏幕的左上角是 (0,0),所以在纵坐标最大值是 100 的坐标系中,需要这么处理。
可以这么实现只由一条 path 构成的图形:
const path = "M" + data.map((d)=> {
  return d.x + ',' + (100 - d.y);
}).join('L');
const line = `<path stroke-width="2" d="${ path }"/>`;
document.querySelector('#chart').innerHTML = line;
上面的代码看着可麻烦了,D3 其实提供了路径生成函数来简化这个步骤:
const line = d3.svg.line()
  .x((d)=> d.x)
  .y((d)=> 100 - d.y)
  .interpolate("linear")

d3.select('#chart')
  .append("path")
  .attr('stroke-width', 2)
  .attr('d', line(data))
清爽多了! interpolate 函数可接受不同的参数,画出不一样的图形,除了 ‘linear’,还可以试试看 ‘basis’、’cardinal’…

Scales
Scales 函数可以将一个输入集映射到一个输出集中。
codepen 中查看代码
上述例子所用的数据都是假数据,不会超过坐标轴所设定的范围。当数据是动态变化的时候,事情可就没有这么简单了,你需要将输入映射到固定范围的输出中,也就是我们的坐标轴。
假设我们有一个 500px X 200px 大小的折线图区域,输入数据是:
const data = [
  { x: 0, y: 30 },
  { x: 25, y: 15 },
  { x: 50, y: 20 }
]
如果 y 轴的范围在 [0,30],x 轴的范围在 [0,50],那数据就能被漂亮地呈现在屏幕上。不过现实是,y 轴范围在0到200,x 轴范围在0到500间。
我们可以用 d3.max 获取到输入数据中的最大的 x 值和 y 值,然后创建出对应的 scales。
scale 和上面用到的颜色差值函数类似,都是将输入值对应到固定的输出范围中。
xScale(0) -> 0
xScale(10) -> 100
xScale(50) -> 500
对于超出输出值范围的输入值,同样适用:
xScale(-10) -> -100
xScale(60) -> 600
在生成折线图的代码中 scale 可以这么使用:
const line = d3.svg.line()
  .x((d)=> xScale(d.x))
  .y((d)=> yScale(d.y))
  .interpolate("linear")
scales 还能让图形更优雅地显示出来,比如加上一点间距:
const padding = 20;
const xScale = d3.scale.linear()
  .domain([0, xMax])
  .range([padding, width - padding])

const yScale = d3.scale.linear()
  .domain([0, yMax])
  .range([height - padding, padding])
现在可以在有动态数据集的前提下生成该集的折线图,这条折线图保证会在 500px X 200px 的范围内,并且距离该区域的四边都有 20px 的间距。
线性的 scale 最常见,不过还有处理指数的 pow、处理非数值数据(比如分类、命名等)的 ordinal scales,除此之外还有 quantitative scales 、 ordinal scales 和 time scales 。
比如把我的寿命当做输入值,映射到 [0,500] 的区域内:
const life = d3.time.scale()
  .domain([new Date(1986, 1, 18), new Date()])
  .range([0, 500])

// 0 到 500 之间的哪个点才是我的 18 岁生日呢?
life(new Date(2004, 1, 18))
航线数据可视化
到目前为止,我们看到的都是静止的图像。接下来,以墨尔本到悉尼的航线为例,试试动态图像吧。
codepen 中查看效果
上面的效果是基于 SVG 的文本 (text)、线条 (line) 和圆形 (circle)。
<svg id="chart" width="600" height="500">
  <text class="time" x="300" y="50" text-anchor="middle">6:00</text>
  <text class="origin-text" x="90" y="75" text-anchor="end">MEL</text>
  <text class="dest-text" x="510" y="75" text-anchor="start">SYD</text>
  <circle class="origin-dot" r="5" cx="100" cy="75" />
  <circle class="dest-dot" r="5" cx="500" cy="75" />
  <line class="origin-dest-line" x1="110" y1="75" x2="490" y2="75" />

  <!-- for each flight in the current time -->
  <g class="flight">
    <text class="flight-id" x="160" y="100">JQ 500</text>
    <line class="flight-line" x1="100" y1="100" x2="150" y2="100" />
    <circle class="flight-dot" cx="150" cy="100" r="5" />
  </g>
</svg>
动态变化的部分是时间和不同的航班,数据源大概长这样:
let data = [
  { departs: '06:00 am', arrives: '07:25 am', id: 'Jetstar 500' },
  { departs: '06:00 am', arrives: '07:25 am', id: 'Qantas 400' },
  { departs: '06:00 am', arrives: '07:25 am', id: 'Virgin 803' }
]
我们需要将每条航线的出发和到达时间用 scale 映射到 x 轴上,这些数据将会动态地变化。在代码开始的位置,就将这些数据依次设定为 Date 对象,并 scale 它们,后面方便使用。对日期的处理我用的是 Moment.js。
data.forEach((d)=> {
  d.departureDate = moment(d.departs, "hh-mm a").toDate();
  d.arrivalDate = moment(d.arrives, "hh-mm a").toDate();
  d.xScale = d3.time.scale()
    .domain([departureDate, arrivalDate])
    .range([100, 500])
});
现在可以把数据传入 xScale() 获取到每条航线的 x 坐标。
渲染循环
出发和到达时间都四舍五入到 5 分钟,所以在第一个航班起飞时间和最后一个航班到达时间之间以 5分钟为单位递增。
let now = moment(data[0].departs, "hh:mm a");
const end = moment(data[data.length - 1].arrives, "hh:mm a");

const loop = function() {
  const time = now.toDate();

  // 选出当前的航班
  const currentData = data.filter((d)=> {
    return d.departureDate <= time && time <= d.arrivalDate
  });

  render(currentData, time);

  if (now <= end) {
    // Increment 5m and call loop again in 500ms
    // 5分钟为增量,500ms 轮询依次
    now = now.add(5, 'minutes');
    setTimeout(loop, 500);
  }
}
创建、更新和过期
在以下场景下,开发者可以指定要使用的数据变换和元素过渡方式:
- 新数据点出现的时候(创建时)
- 现有的数据发生变化(更新时)
- 数据不再使用时(过期时)
const render = function(data, time) {
  // 渲染 'time'
  d3.select('.time')
    .text(moment(time).format("hh:mm a"))

  // 创建 selection,传入数据集
  const flight = d3.select('#chart')
    .selectAll('g.flight')
    .data(data, (d)=> d.id)

  // 为新的数据创建节点
  const newFlight = flight.enter()
    .append("g")
    .attr('class', 'flight')

  const xPoint = (d)=> d.xScale(time);
  const yPoint = (d, i)=> 100 + i * 25;

  newFlight.append("circle")
    .attr('class',"flight-dot")
    .attr('cx', xPoint)
    .attr('cy', yPoint)
    .attr('r', "5")

  // 通过 select 更新现有的数据
  flight.select('.flight-dot')
    .attr('cx', xPoint)
    .attr('cy', yPoint)

  // 移除不需要的数据
  const oldFlight = flight.exit()
    .remove()
}
过渡
上述的代码实现了每 500ms 以 5 分钟为增量渲染画面:
- 更新了时间
- 每当有新的航班图时,以圆为标识创建
- 更新当前航班的 x/y 坐标轴
- 当飞机到达目的地时,移除数据
可以说已经实现了我们开始时的目标,但是每次新数据的出现和旧数据的销毁都太粗暴。通过在 D3 selection 上添加过渡,就能把这个过程变得平滑。
比如,为新数据添加到 DOM 结构中,通过改变透明度 (opacity),加一个渐现动画:
const newFlight = flight.enter()
  .append("g")
  .attr('class', 'flight')
  .attr('opacity', 0)

newFlight.transition()
  .duration(500)
  .attr('opacity', 1)
数据移除可以加上渐隐动画:
flight.exit()
  .transition()
  .duration(500)
  .attr('opacity', 0)
  .remove()
在横纵坐标点上也可以加上:
flight.select('.flight-dot')
  .transition()
  .duration(500)
  .ease('linear')
  .attr('cx', xPoint)
  .attr('cy', yPoint)
我们也能对这 5 分钟的增量做过渡,用 tween 函数实现每分钟时间都将出现,而不是每 5 分钟才会出现。
const inFiveMinutes = moment(time).add(5, 'minutes').toDate();
const i = d3.interpolate(time, inFiveMinutes);
d3.select('.time')
  .transition()
  .duration(500)
  .ease('linear')
  .tween("text", ()=> {
    return function(t) {
      this.textContent = moment(i(t)).format("hh:mm a");
    };
  });
t 是用于变换的一个介于 0 到 1 的增长值。
做个有创造力的人
D3 能做的事太多,虽然很想挖地更深一点,但我还是不在这本末倒置地一一讲解了。
- 极地时钟
- Force Layouts
- 世界地图 & 3D 地球
- Voronoi Tessellation
- Prim’s Algorithm V
- OMG Particles II
在 D3 Gallery 中你能找到更多例子。我强烈推荐 Scott Murray 的 D3 教程 和 D3 的官方文档 。
希望读完这篇文章后你大概了解了要怎么使用 Selections、Scales 和 Transitions,能思索出独一无二的能极好地可视化数据的方案,实现之后可别忘了在评论区告诉我哦!


![[HBLOG]公众号](https://www.liuhaihua.cn/img/qrcode_gzh.jpg)

