Spring Cloud (8) —— Dashboard
关于
hystrix
生成运行数据。
Hystrix 只监控 @HystrixCommand ,只要想对服务进行监控,就必须加 @HystrixCommand,没有降级方法也要加。
actuator
收集运行数据。
dashboard
展示运行数据。
部署 dashborad
- 新建模块
spring-cloud.s06.dashboard -
在
pom中添加依赖<dependencies> <dependency> <groupId>org.springframework.cloud</groupId> <artifactId>spring-cloud-starter-netflix-eureka-client</artifactId> </dependency> <dependency> <groupId>org.springframework.boot</groupId> <artifactId>spring-boot-starter-web</artifactId> </dependency> <dependency> <groupId>org.springframework.boot</groupId> <artifactId>spring-boot-starter-actuator</artifactId> </dependency> <dependency> <groupId>org.springframework.cloud</groupId> <artifactId>spring-cloud-starter-netflix-hystrix</artifactId> </dependency> <dependency> <groupId>org.springframework.cloud</groupId> <artifactId>spring-cloud-starter-netflix-hystrix-dashboard</artifactId> </dependency> </dependencies> -
添加配置文件
application.ymlserver: port: 35001 spring: application: name: hystrix-dashboard profiles: active: dev eureka: instance: hostname: localhost instance-id: ${spring.cloud.client.ip-address}:${server.port} client: serviceUrl: defaultZone: http://user:123123@localhost:34001/eureka/ -
创建启动类
..HystrixDashboard@SpringBootApplication @EnableHystrixDashboard public class HystrixDashboard { public static void main(String[] args) { SpringApplication.run(HystrixDashboard.class, args); } } - 启动项目,访问
http://localhost:35001/hystrix可见控制台。
监控数据的来源
HystrixDashboard 只能展示被 @HystrixCommand 标记的方法的运行数据。这里使用 store-hystrix 项目提供。想要向外提供hystrix 的监控数据,还需要完成一些让工作。
-
完善项目
store-hystrix的启动类..StoreHystrix,增加@Bean public ServletRegistrationBean getServlet(){ HystrixMetricsStreamServlet streamServlet = new HystrixMetricsStreamServlet(); //监控实例 ServletRegistrationBean registrationBean = new ServletRegistrationBean(streamServlet); //servlet注册接口 registrationBean.setLoadOnStartup(1); registrationBean.addUrlMappings("/actuator/hystrix.stream"); //路径 registrationBean.setName("HystrixMetricsStreamServlet"); return registrationBean; }这样,该项目的
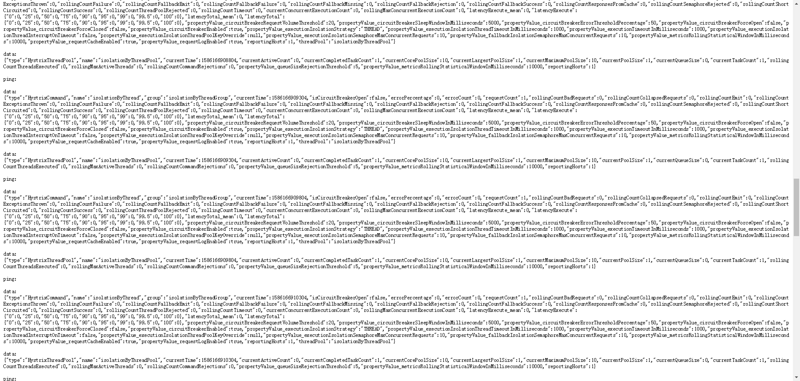
/actuator/hystrix.stream端点才可以输入数据。 - 访问
http://localhost:31003/actuator/hystrix.stream可以看到ping信息不停刷新。

- 访问一个标记了 @HystrixCommand 的方法
http://localhost:31003/hystrix/isolation/thread,再重新回到http://localhost:31003/actuator/hystrix.stream可以看到data一同刷新。
在 dashboard 查看监控数据
运行正常
- 将
http://localhost:31003/actuator/hystrix.stream输入到对话框,点击 Monitor Stream 后可以看到一个空的运行曲线。 -
接下来访问 http://localhost :31003/hystrix/isolation/thread 让标记 @HystrixCommand 的程序运行,可以看到监控数据的变化。
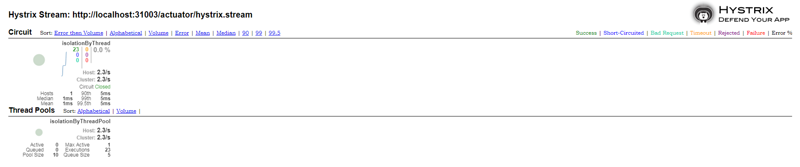
左边图标中,不同意义的数字用不同的颜色显示,具体的含义对照右边的说明。
运行发生降级
-
可能产生异常的访问
http://localhost:31003/hystrix/cf/always-exception
http://localhost:31003/hystrix/isolation/thread
http://localhost:31003/hystrix/isolation/semaphore
- 使用 1 个线程,不间断的想三个地址发起压测
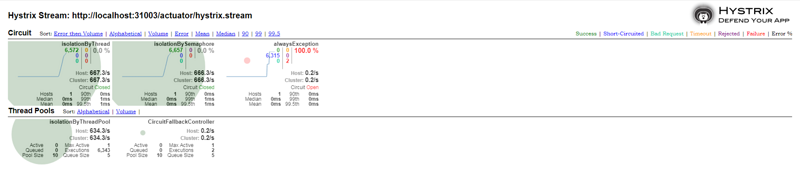
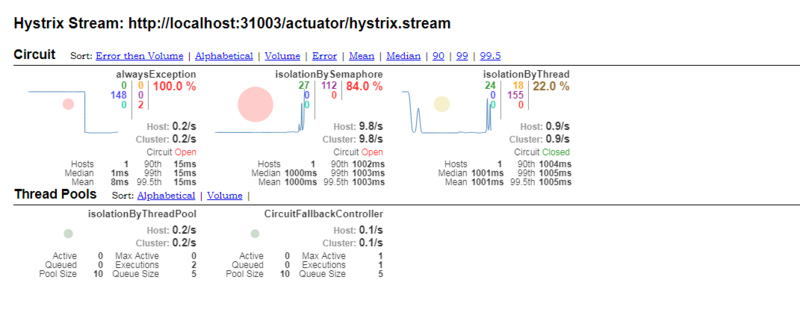
- 在上面3个方法中添加了延迟代码,使用100 个线程进行压测
正文到此结束
热门推荐


相关文章


Loading...
![[HBLOG]公众号](https://www.liuhaihua.cn/img/qrcode_gzh.jpg)

