使用 Spring Boot Admin 监控服务
Spring Boot Admin 简介
随着开发周期的推移,项目会不断变大,切分出的服务也会越来越多,这时一个个的微服务构成了错综复杂的系统。
对于各个微服务系统的健康状态、会话数量、并发数、服务资源、延迟等度量信息的收集就成为了一个挑战。 Spring Boot Admin 就是基于这些需求开发出的一套功能强大的监控管理系统。
同样, Spring Boot Admin 也是由两个角色组成,一个是服务端 Spring Boot Admin Server ,一个是客户端 Spring Boot Admin Client 。
Spring Boot Admin 服务端
引入依赖
在 pom.xml 中主要添加 spring-cloud-starter-netflix-eureka-server 、 spring-boot-admin-starter-server 和 jolokia-core 依赖
<dependency>
    <groupId>org.springframework.cloud</groupId>
    <artifactId>spring-cloud-starter-netflix-eureka-server</artifactId>
</dependency>
<dependency>
    <groupId>de.codecentric</groupId>
    <artifactId>spring-boot-admin-starter-server</artifactId>
</dependency>
<dependency>
    <groupId>org.jolokia</groupId>
    <artifactId>jolokia-core</artifactId>
</dependency>
相关配置
在 application.yml 中主要添加 Spring Boot Admin 相关配置
management:
  endpoint:
    health:
      show-details: always
  endpoints:
    web:
      exposure:
        include: health,info
Spring Boot Admin 客户端
在所需要被监控的项目中添加以下配置
引入依赖
在 pom.xml 中添加 spring-boot-admin-starter-client 和 jolokia-core 依赖
<dependency>
    <groupId>de.codecentric</groupId>
    <artifactId>spring-boot-admin-starter-client</artifactId>
</dependency>
<dependency>
    <groupId>org.jolokia</groupId>
    <artifactId>jolokia-core</artifactId>
</dependency>
相关配置
在 application.yml 中添加 spring boot admin 地址即可
spring:
 boot:
   admin:
     client:
       url: http://localhost:8084
测试服务监控
打开浏览器访问: http://localhost:8084 ,出现以下界面
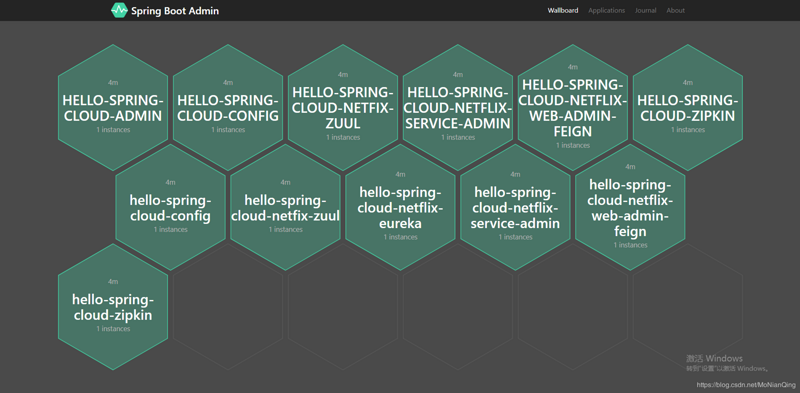
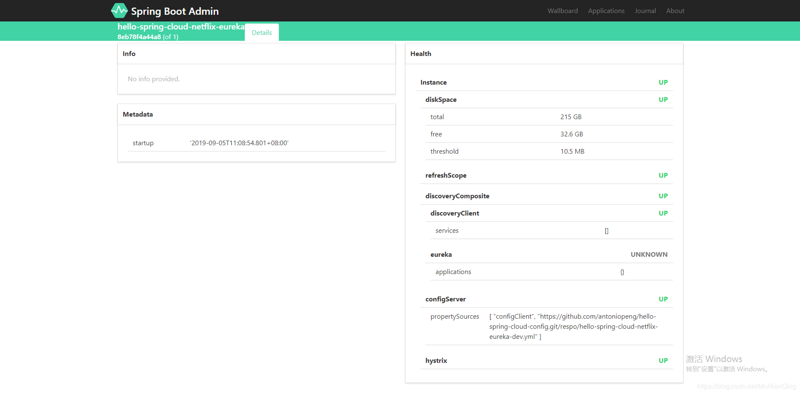
服务监控详情页面
- 文章作者:彭超
- 本文首发于个人博客: https://antoniopeng.com/2019/12/12/springboot/%E4%BD%BF%E7%94%A8SpringBootAdmin%E7%9B%91%E6%8E%A7%E6%9C%8D%E5%8A%A1/
- 版权声明:本博客所有文章除特别声明外,均采用 CC BY-NC-SA 4.0 许可协议。转载请注明来自 彭超 | Blog !
正文到此结束
热门推荐


相关文章

近期评论
-
ws0132613@gmail.comhttps://getmacos.com/gopanel/william smith
-
谢谢
-
https://www.newcmy.com/register?aff=HBVX建议您试试草莓云机场,可以流畅观看youtube和tiktok,上reddit/x也没有问题,还有各种ai优化节点。
-
-
-
想购买您这个站,我的联系方式QQ741756694微信同步 能卖联系
-
-
-
-
Loading...
![[HBLOG]公众号](https://www.liuhaihua.cn/img/qrcode_gzh.jpg)

