logistic回归
回归就是对已知公式的未知参数进行估计。比如已知公式是$y = a*x + b$,未知参数是a和b,利用多真实的(x,y)训练数据对a和b的取值去自动估计。估计的方法是在给定训练样本点和已知的公式后,对于一个或多个未知参数,机器会自动枚举参数的所有可能取值,直到找到那个最符合样本点分布的参数(或参数组合)。
logistic分布
设X是连续随机变量,X服从logistic分布是指X具有下列分布函数和密度函数:
$$F(x)=P(x /le x)=/frac 1 {1+e^{-(x-/mu)//gamma}}//f(x)=F^{‘}(x)=/frac {e^{-(x-/mu)//gamma}} {/gamma(1+e^{-(x-/mu)//gamma})^2}$$
其中,$/mu$为位置参数,$/gamma$为形状参数。
$f(x)$与$F(x)$图像如下,其中分布函数是以$(/mu, /frac 1 2)$为中心对阵,$/gamma$越小曲线变化越快。

logistic回归模型
二项logistic回归模型如下:
$$P(Y=1|x)=/frac {exp(w /cdot x + b)} {1 + exp(w /cdot x + b)} //P(Y=0|x)=/frac {1} {1 + exp(w /cdot x + b)}$$
其中,$x /in R^n$是输入,$Y /in {0,1}$是输出,w称为权值向量,b称为偏置,$w /cdot x$为w和x的内积。
参数估计
假设:
$$P(Y=1|x)=/pi (x), /quad P(Y=0|x)=1-/pi (x)$$
则似然函数为:
$$/prod_{i=1}^N [/pi (x_i)]^{y_i} [1 - /pi(x_i)]^{1-y_i}$$
求对数似然函数:
$$L(w) = /sum_{i=1}^N [y_i /log{/pi(x_i)} + (1-y_i) /log{(1 - /pi(x_i)})]//=/sum_{i=1}^N [y_i /log{/frac {/pi (x_i)} {1 - /pi(x_i)}} + /log{(1 - /pi(x_i)})]$$
从而对$L(w)$求极大值,得到$w$的估计值。
求极值的方法可以是梯度下降法,梯度上升法等。
梯度上升确定回归系数
logistic回归的sigmoid函数:
$$/sigma (z) = /frac 1 {1 + e^{-z}}$$
假设logstic的函数为:
$$y = w_0 + w_1 x_1 + w_2 x_2 + … + w_n x_n$$
可简写为:
$$y = w_0 + w^T x$$
梯度上升算法是按照上升最快的方向不断移动,每次都增加$/alpha /nabla_w f(w)$,
$$w = w + /alpha /nabla_w f(w) $$
其中,$/nabla_w f(w)$为函数导数,$/alpha$为增长的步长。
训练算法
- 每个回归系数都初始化为1
- 重复N次
- 计算整个数据集合的梯度
- 使用$/alpha /cdot /nabla f(x)$来更新w向量
- 返回回归系数
#!/usr/bin/env python
# encoding:utf-8

import math
import numpy
import time
import matplotlib.pyplot as plt


def sigmoid(x):
    return 1.0 / (1 + numpy.exp(-x))


def loadData():
    dataMat = []
    laberMat = []
    with open("test.txt", 'r') as f:
        for line in f.readlines():
            arry = line.strip().split()
            dataMat.append([1.0, float(arry[0]), float(arry[1])])
            laberMat.append(float(arry[2]))
    return numpy.mat(dataMat), numpy.mat(laberMat).transpose()


def gradAscent(dataMat, laberMat, alpha=0.001, maxCycle=500):
    """general gradscent"""
    start_time = time.time()
    m, n = numpy.shape(dataMat)
    weights = numpy.ones((n, 1))
    for i in range(maxCycle):
        h = sigmoid(dataMat * weights)
        error = laberMat - h
        weights += alpha * dataMat.transpose() * error
    duration = time.time() - start_time
    print "duration of time:", duration
    return weights


def stocGradAscent(dataMat, laberMat, alpha=0.01):
    start_time = time.time()
    m, n = numpy.shape(dataMat)
    weights = numpy.ones((n, 1))
    for i in range(m):
        h = sigmoid(dataMat[i] * weights)
        error = laberMat[i] - h
        weights += alpha * dataMat[i].transpose() * error
    duration = time.time() - start_time
    print "duration of time:", duration
    return weights


def betterStocGradAscent(dataMat, laberMat, alpha=0.01, numIter=150):
    """better one, use a dynamic alpha"""
    start_time = time.time()
    m, n = numpy.shape(dataMat)
    weights = numpy.ones((n, 1))
    for j in range(numIter):
        for i in range(m):
            alpha = 4 / (1 + j + i) + 0.01
            h = sigmoid(dataMat[i] * weights)
            error = laberMat[i] - h
            weights += alpha * dataMat[i].transpose() * error
    duration = time.time() - start_time
    print "duration of time:", duration
    return weights
    start_time = time.time()


def show(dataMat, laberMat, weights):
    m, n = numpy.shape(dataMat)
    min_x = min(dataMat[:, 1])[0, 0]
    max_x = max(dataMat[:, 1])[0, 0]
    xcoord1 = []; ycoord1 = []
    xcoord2 = []; ycoord2 = []
    for i in range(m):
        if int(laberMat[i, 0]) == 0:
            xcoord1.append(dataMat[i, 1]); ycoord1.append(dataMat[i, 2])
        elif int(laberMat[i, 0]) == 1:
            xcoord2.append(dataMat[i, 1]); ycoord2.append(dataMat[i, 2])
    fig = plt.figure()
    ax = fig.add_subplot(111)
    ax.scatter(xcoord1, ycoord1, s=30, c="red", marker="s")
    ax.scatter(xcoord2, ycoord2, s=30, c="green")
    x = numpy.arange(min_x, max_x, 0.1)
    y = (-weights[0] - weights[1]*x) / weights[2]
    ax.plot(x, y)
    plt.xlabel("x1"); plt.ylabel("x2")
    plt.show()


if __name__ == "__main__":
    dataMat, laberMat = loadData()
    #weights = gradAscent(dataMat, laberMat, maxCycle=500)
    #weights = stocGradAscent(dataMat, laberMat)
    weights = betterStocGradAscent(dataMat, laberMat, numIter=80)
    show(dataMat, laberMat, weights)
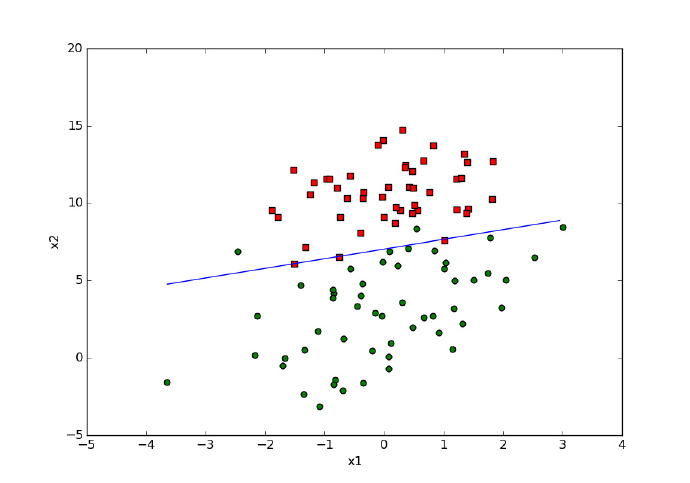
未优化的程序结果如下,

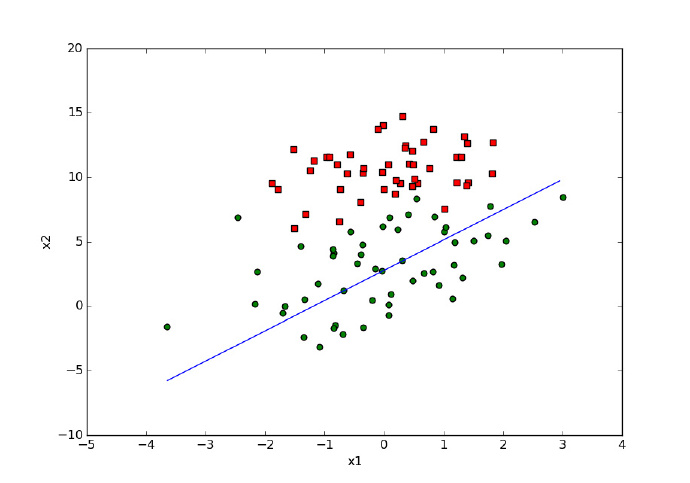
随机梯度上升算法(降低了迭代的次数,算法较快,但结果不够准确)结果如下,

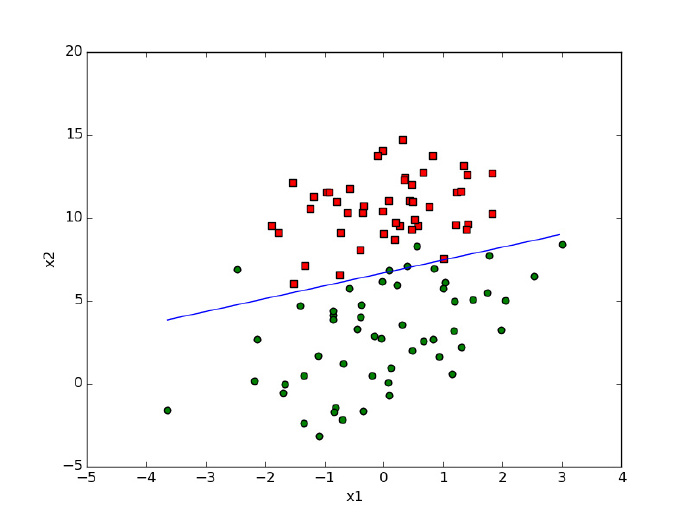
对$/alpha$进行优化,动态调整步长(同样降低了迭代次数,但是由于代码采用动态调整alpha,提高了结果的准确性),结果如下


![[HBLOG]公众号](https://www.liuhaihua.cn/img/qrcode_gzh.jpg)

